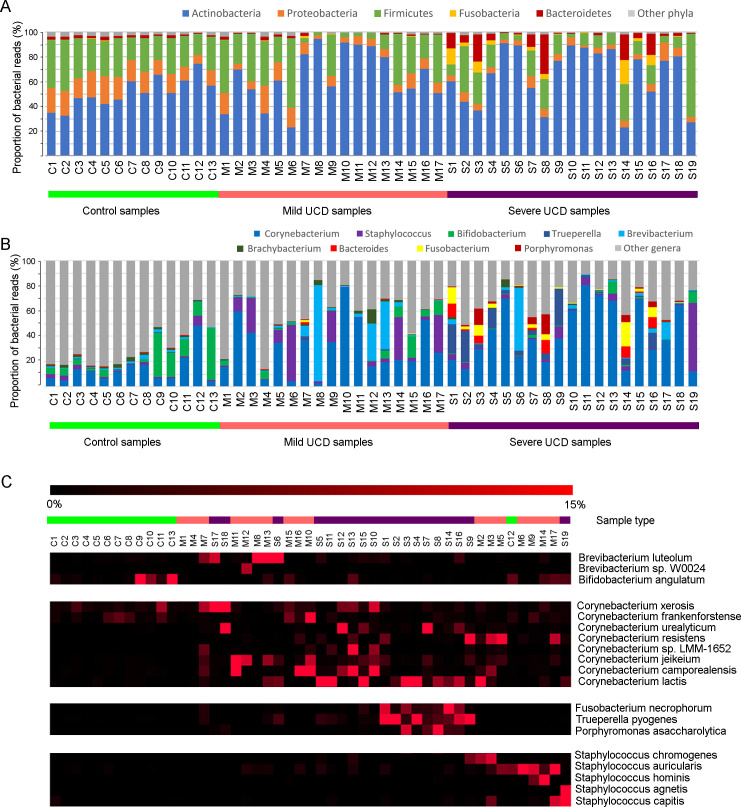
Fig 4. Bacterial abundance.
Distribution of bacterial phyla (A), genera (B) and species (C) representing ≥10% of the classified reads in at least one sample out of 49 samples from mild (n = 17) and severe (n = 19) udder cleft dermatitis (UCD) lesions and skin samples from healthy controls (n = 13) in a study of the microbiota of UCD in comparison to healthy skin using shotgun metagenomic sequencing. On the species level (C), the order of the samples was changed to highlight the major subgroups that were distinguishable, and the red colour indicates the percentage (0–15%) of the bacterial reads for each species within each sample.

