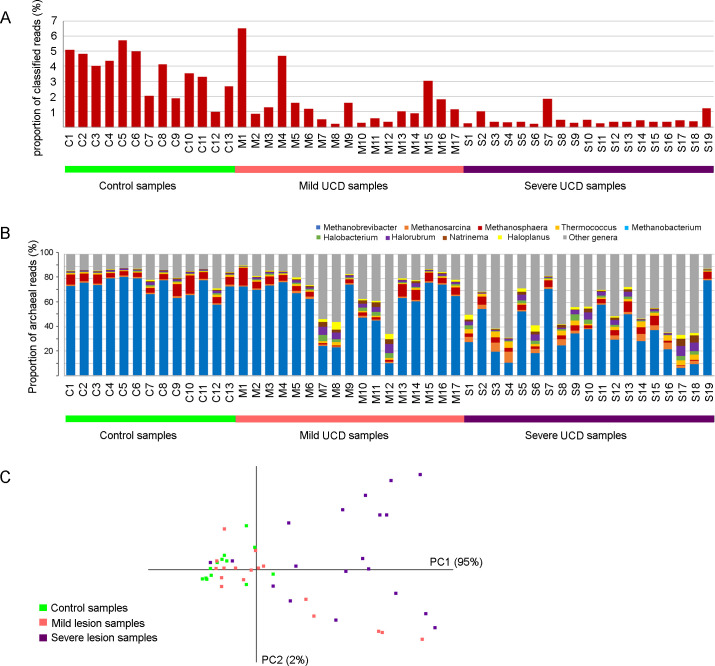
Fig 6. Archaeal abundance.
The archaeal proportion of all classified reads within each sample (A), the distribution of archaeal genera representing ≥5% of the archaeal reads in at least one sample (B) and a principal component analysis (C), based on samples from mild (n = 17) and severe (n = 19) udder cleft dermatitis (UCD) and samples from skin at the fore udder attachment from healthy controls (n = 13).

