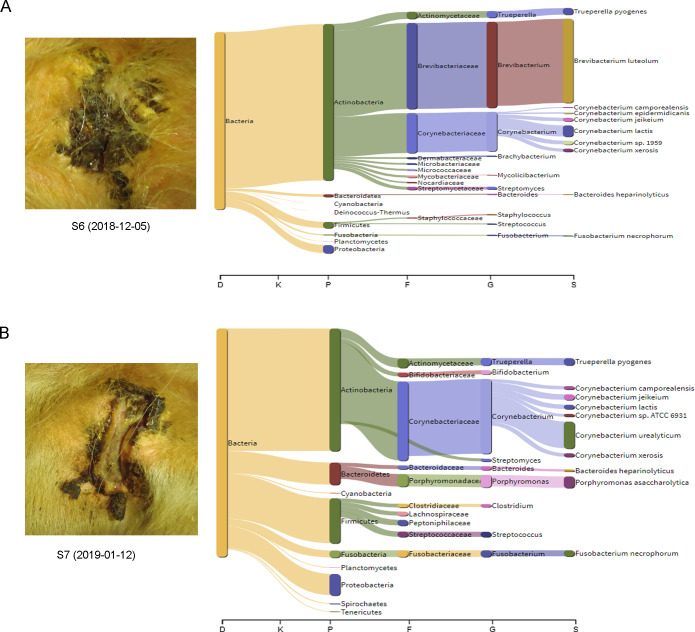
Fig 8. Example 2.
Sankey visualization (obtained by the metagenomics tool Pavian) of the microbiota of a severe udder cleft dermatitis (UCD) lesion sampled at two different time points from the same cow, in October 2018 (A) and in January 2019 (B). The flow diagram illustrates the proportion of bacterial reads assigned to a specific taxon at domain (D), kingdom (K), phylum (P), family (F), genera (G) and species level.

