
Fig 4. Receiver Operating Characteristic (ROC) curves of the values for CT-based texture features and US elastographic FLRs.
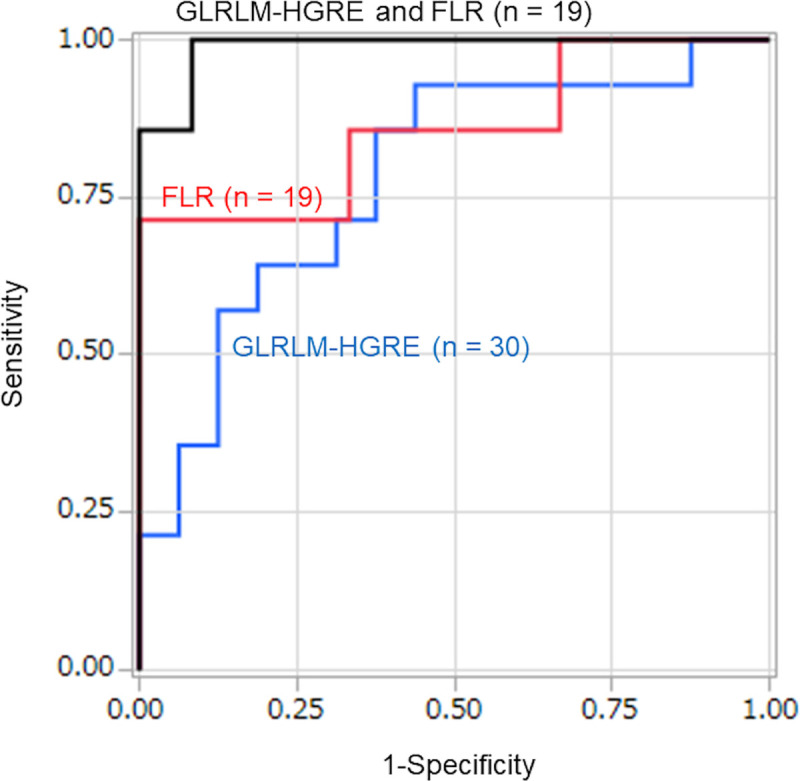
ROC curves of the grey-level run length matrix (GLRLM)-high gray-level emphasis (HGRE) feature and the fat-to-lesion strain ratio (FLR), and the ROC of the combination of GLRLM-HGRE and FLR, which shows almost perfect diagnostic accuracy for distinguishing between lymphadenopathy due to sarcoidosis and that due to metastasis from small cell lung cancer. The area-under-the-curve values were as follows: GLRLM-HGRE alone, 0.781; FLR alone, 0.857; combination of GLRLM-HGRE plus FLR, 0.988.