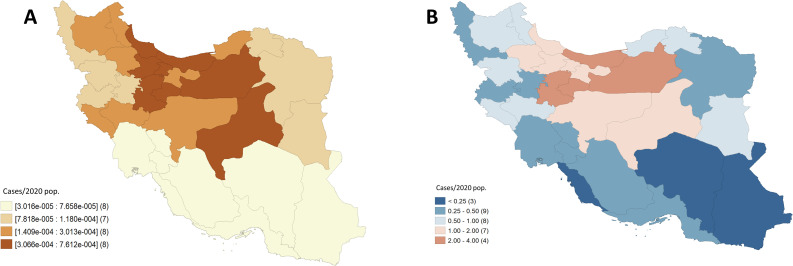
Fig 1. Maps associated with COVID-19 cases by province from February 19th to March 20th, 2020.
A) Quartiles corresponding to rates smoothed through an empirical Bayes procedure. B) Excess or relative risk. Shapefiles obtained from the Stanford Libraries Earthworks: https://earthworks.stanford.edu/catalog/stanford-dv126wm3595.

