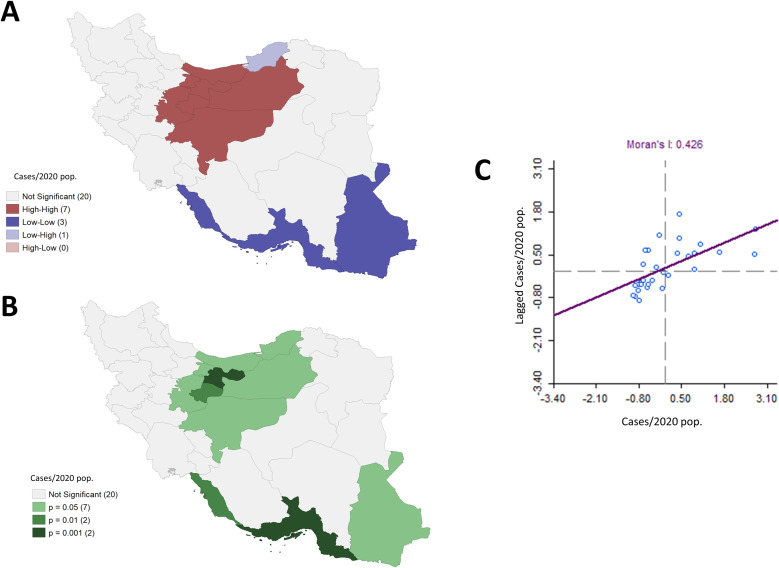
Fig 2. Spatial clustering associated with rates of COVID-19 cases by province from February 19th to March 20th, considering queen contiguity weights.
A) Significant spatial clustering obtained through Local Indicators of Spatial Autocorrelation (LISA) comparisons. Four types of a cluster are possible: High-High, Low-Low, High-Low, and Low-High. For instance, the High-High cluster (red) indicates provinces with high values of a variable that are significantly surrounded by regions with similarly high values. B) P-values associated with the spatial clustering in A), C) Scatter plot associated with the smoothed rates vs. their corresponding spatially lagged values, including the associated linear regression fitting, whose slope corresponds to the Moran's I statistic, a global spatial autocorrelation measure. Shapefiles obtained from the Stanford Libraries Earthworks: https://earthworks.stanford.edu/catalog/stanford-dv126wm3595.

