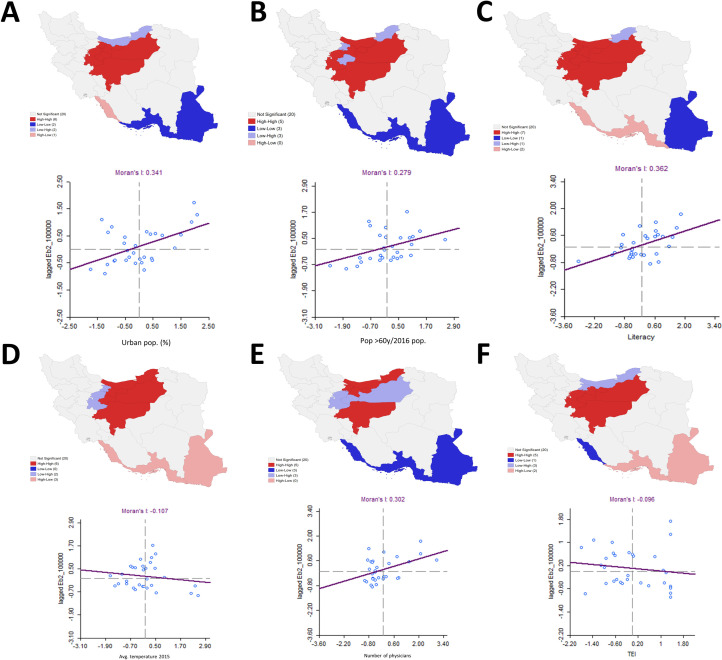
Fig 4. Bivariate LISA's significant spatial clustering between each of the significant variables in the spatial lag model and the rate of cases with COVID-19 smoothed through the empirical Bayes approach.
The scatter plots associated with the variables vs. the spatially lagged smoothed rate of COVID-19 cases are presented as well, including the associated linear regression fitting, whose slope corresponds to the bivariate Moran's I statistic, a global spatial bivariate autocorrelation measure. A) People settled in urban areas in 2016 (%). B) People aged ≥60 years, rates obtained through empirical Bayes smoothing. C) Literacy of population aged ≥6 years in 2016 (%). D) Average temperature (°C) of provincial capitals in 2015. E) Number of physicians employed by the ministry of health and medical education in 2006. F) Transportation Efficiency Index (TEI). Shapefiles obtained from the Stanford Libraries Earthworks: https://earthworks.stanford.edu/catalog/stanford-dv126wm3595.

