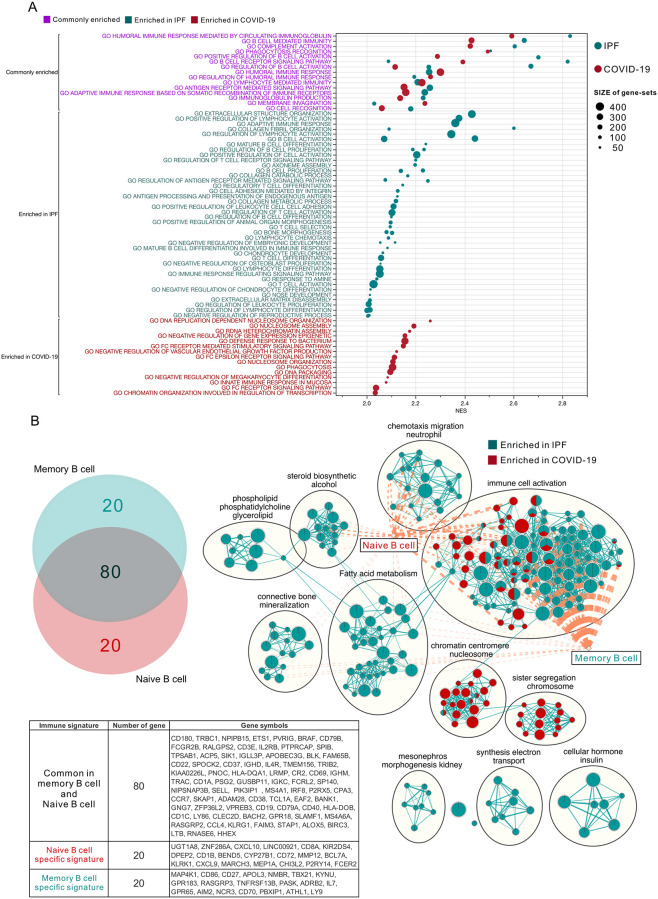
Fig 5. GO:BP functional enrichment map summary of GSEA in the lung tissues of COVID-19 and IPF patients.
(A) The top NES-ranked enrichment results of biological processing by gene ontology (GO) functional enrichment analysis in IPF or COVID-19 (NES > 2; FDR < 0.05). The normalized enrichment score (NES) was presented in the X-axis, and the names of enriched functional gene sets were shown in the Y-axis. The color gradation on the right side indicates false discovery rate (FDR). Size represents the number of genes in the gene set. Color of the text represents whether the gene set was enriched in both (purple) or in individual type of disease (COVID-19: Red, IPF: Green). (B) Venn diagram: two circles represent the intersection status of the top 100 genes from the Naive B cell (Red) and Memory B cell (Green) subtypes extracted from the LM22 immune cell gene signatures, respectively. The detailed list of genes in the intersection is shown in the table below. Enrichment map: Commonality of positive enrichments in the GO:BP gene sets after GSEA assessment using enrichment map visualization in COVID-19 (GSE150316, Red) and IPF (GSE124685 and GSE53845, Green). Single color: the node is positively correlated in only one disease condition; Mixed: the node is positively correlated in two or three databases. Diamond: Naïve or Memory B cell specific signature, genes in the signature were shown in the table below. Lines connecting nodes or diamonds represent the degree of overlapping between two gene sets. Criteria for enrichment significance screening: P-value <0.05, FDR <0.05.

