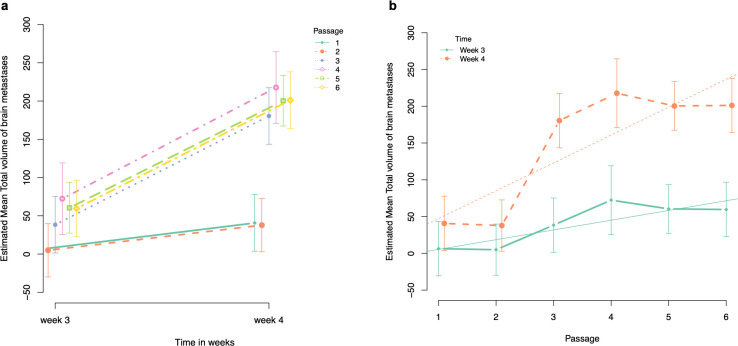
Fig 4. Graphical illustration of the estimated mean total volume of brain metastases.
a. Estimated mean total volume of brain metastases at week 3 and week 4 after intracardiac injection of the cancer cells for each passage. b. Evolution of the estimated mean total volume of brain metastases per passage at week 3 and 4 after intracardiac injection of the cancer cells.

