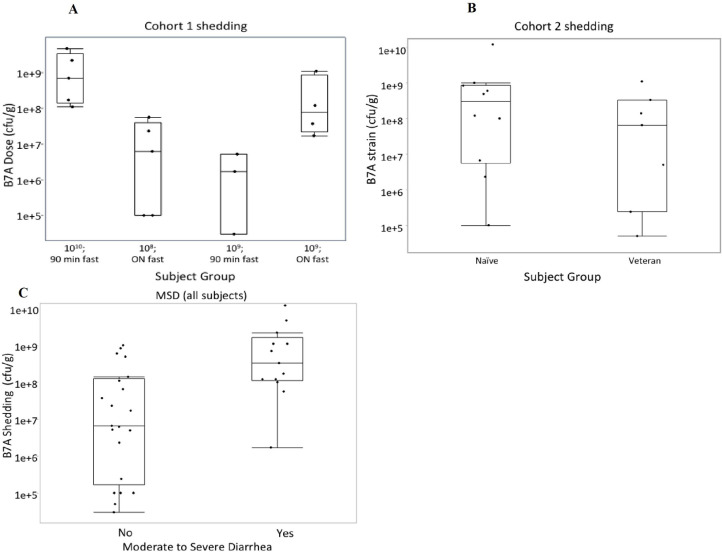
Fig 3.
Comparison of median shedding 2 days after challenge with ETEC strain B7A based on (A) subjects in Cohort 1 (B) subjects in Cohort 2 and (C) subjects with and without moderate-severe diarrhea. The shedding value for each subject is represented by a dot on the figure based on (A) the dose/fasting time to which that subject was randomized, (B) veteran status, and (C) whether the subject experienced MSD. The horizontal line within the box represents the median sample value. The ends of the box represent the 1st and 3rd quartile. The whiskers extend from the ends of the box to the outermost data point that falls within the distances computed as 1st/3rd quartile—1.5*(interquartile range). Quantitative shedding was not evaluated for subjects who had initiated antibiotic treatment or did not produce a stool sample at the time point.

