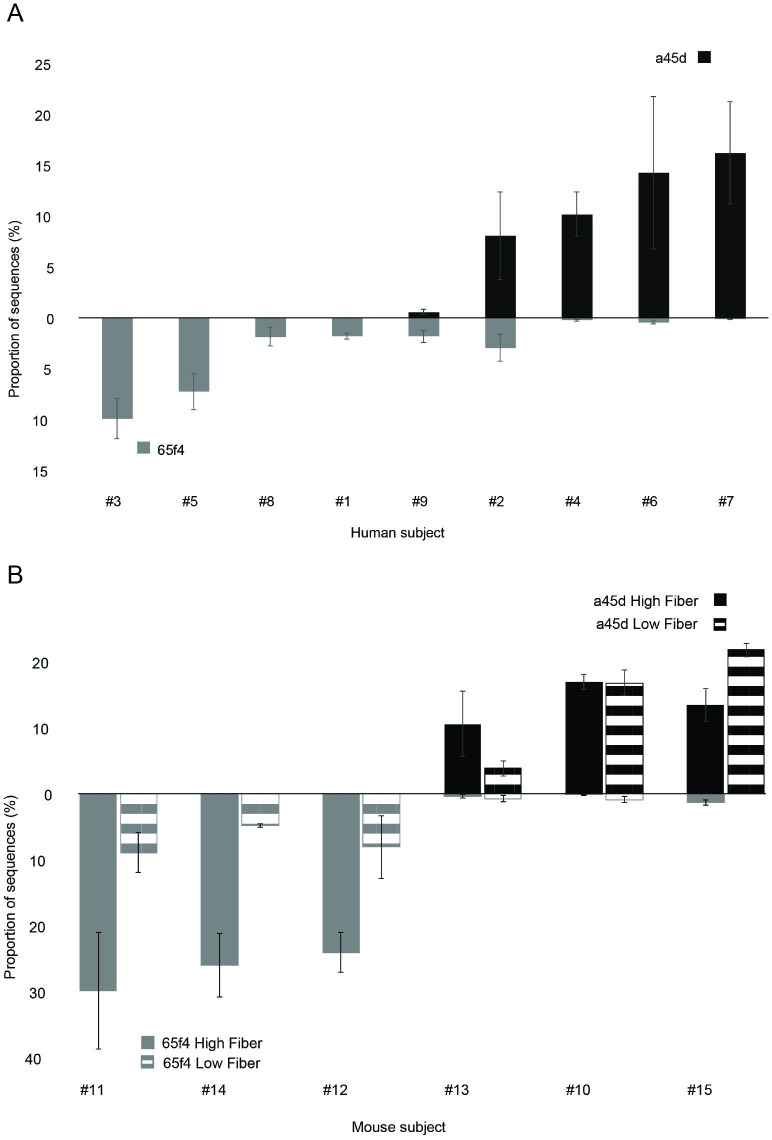
Fig 3. Relative abundances of ASV_65f4 and ASV_a45d are negatively correlated.
Relative abundance of ASV_65f4 and ASV_a45d in human (A) and human microbiota-associated mice fecal samples (B). ASV_65f4 is represented in gray and ASV_a45d in black. In the bottom panel, libraries from HMAM mice fed a diet high in fiber are shown in solid color and mice fed a diet low in fiber are shown with a line pattern. Error bars correspond to 3 incubations done with fecal matter from the same donor individually sampled. For human samples (n = 9), relative abundances obtained for the second incubation are shown and for HMAM mice (n = 6), relative abundances obtained after 7 days of incubation with quercetin are shown.

