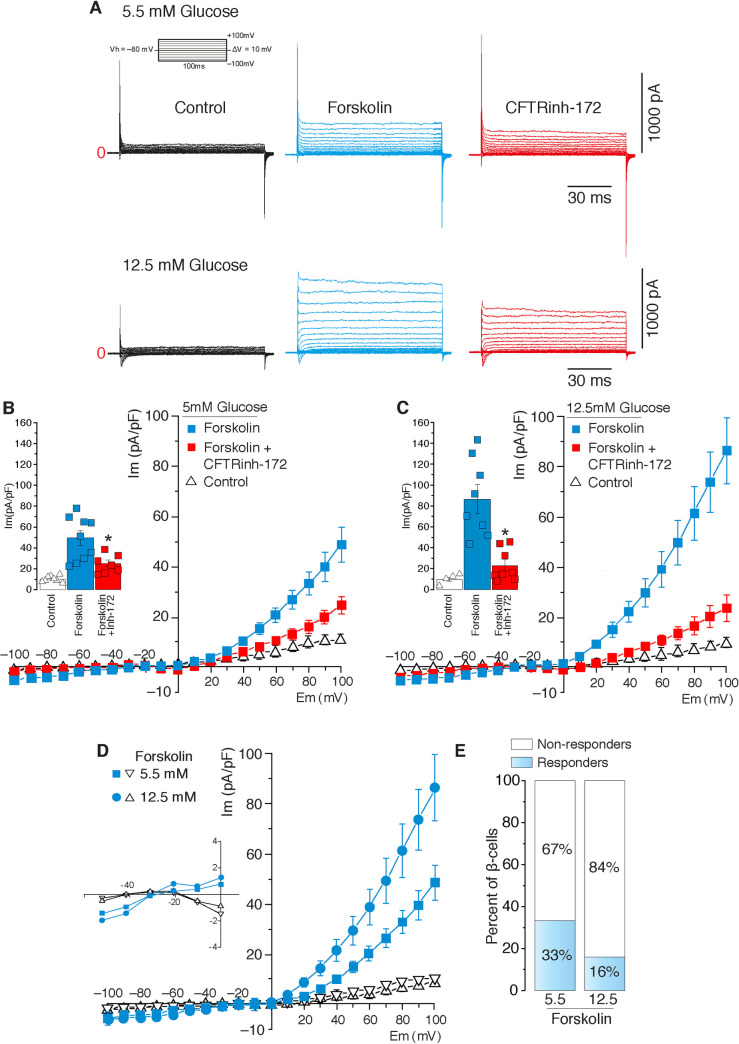
Fig 6. Cftr is functionally detected in rat β-cells.
A. Representative Cl−currents recorded using rat primary pancreatic β-cells pre-incubated for 1h in 5.5 or 12.5mM glucose before (control, black trace), after forskolin addition (10μM, blue trace) alone or 5 min after adding CFTRinh-172 (5μM, red trace). B, C. Current density-voltage relationships of β-cell Cl−currents recorded in 5.5mM (n = 10) glucose (B) or 12.5mM (n = 8) glucose (C) in the presence of forskolin (10μM, blue squares) alone or plus CFTR-inh-172 (5μM, red squares). Insets in B and C denote peak currents at +100mV (n = 8, for all conditions, *p<0.05). D. Current density-voltage relationship of β-cell Cl−currents in 5.5mM or 12.5 mM glucose after addition of forskolin (10μM). Traces show β-cell responders (blue circles/squares, n = 10 and n = 8 for 5.5mM and 12.5 mM respectively) and non-responders to forskolin in 5.5mM or 12.5mM glucose (open triangles, n = 19 and n = 41, respectively). E. Numerical proportion of the latter observation.

