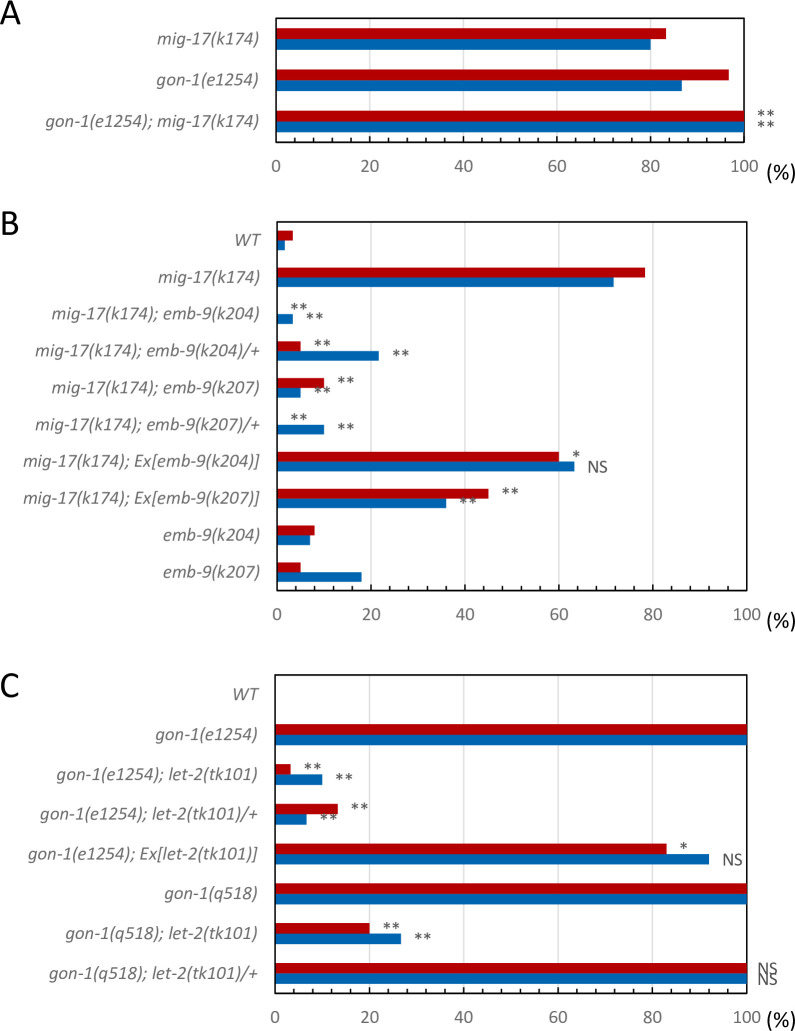
Fig 2. DTC migration phenotypes of mig-17, gon-1 and the suppressors.
A. Percentage of DTC migration defects in mig-17(k174) and gon-1(e1254) single mutants and their double mutants. P-values from Fisher’s exact test comparing the double mutants with mig-17(k174) animals: **P < 0.01. B. Percentage of DTC migration defects in mig-17(k174) animals with the emb-9(k204) or emb-9(k207) mutation or with extrachromosomal arrays carrying these mutant genes. P-values from Fisher’s exact test comparing the double mutants with mig-17(k174) animals: **P < 0.01; *P < 0.05; NS, not significant. C. Percentage of DTC migration defects in gon-1(e1254) or gon-1(q518) animals with a let-2(tk101) mutation or with an extrachromosomal array carrying the let-2(tk101) mutant gene. P-values from Fisher’s exact test comparing the double mutants with gon-1(e1254) animals: **P < 0.01; *P < 0.05; NS, not significant. Red and blue bars represent defects in anterior and posterior gonad arms, respectively.

