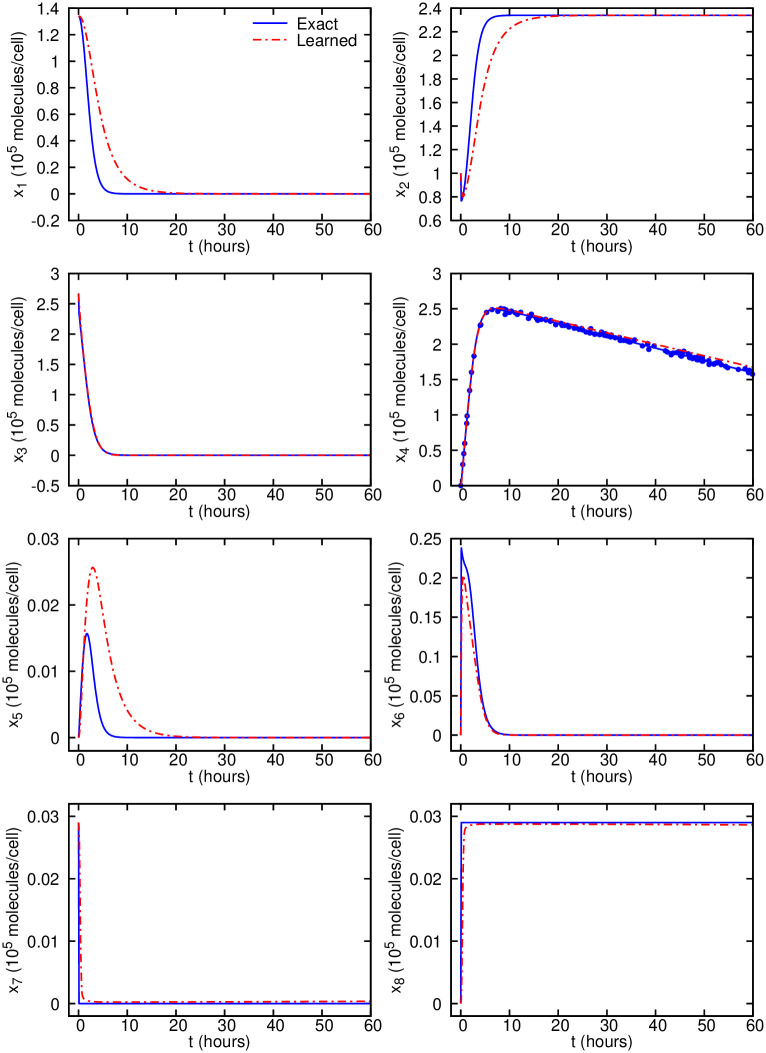
Fig 5. Cell apoptosis inferred dynamics from noisy observations compared with the exact solution.
Predictions are performed on equally-spaced time instants in the interval of 0 − 60 hours. The scattered observations are plotted using symbols only for the observable x4. The exact data and the scattered observations are computed by solving the system of ODEs given in S3 Text.

