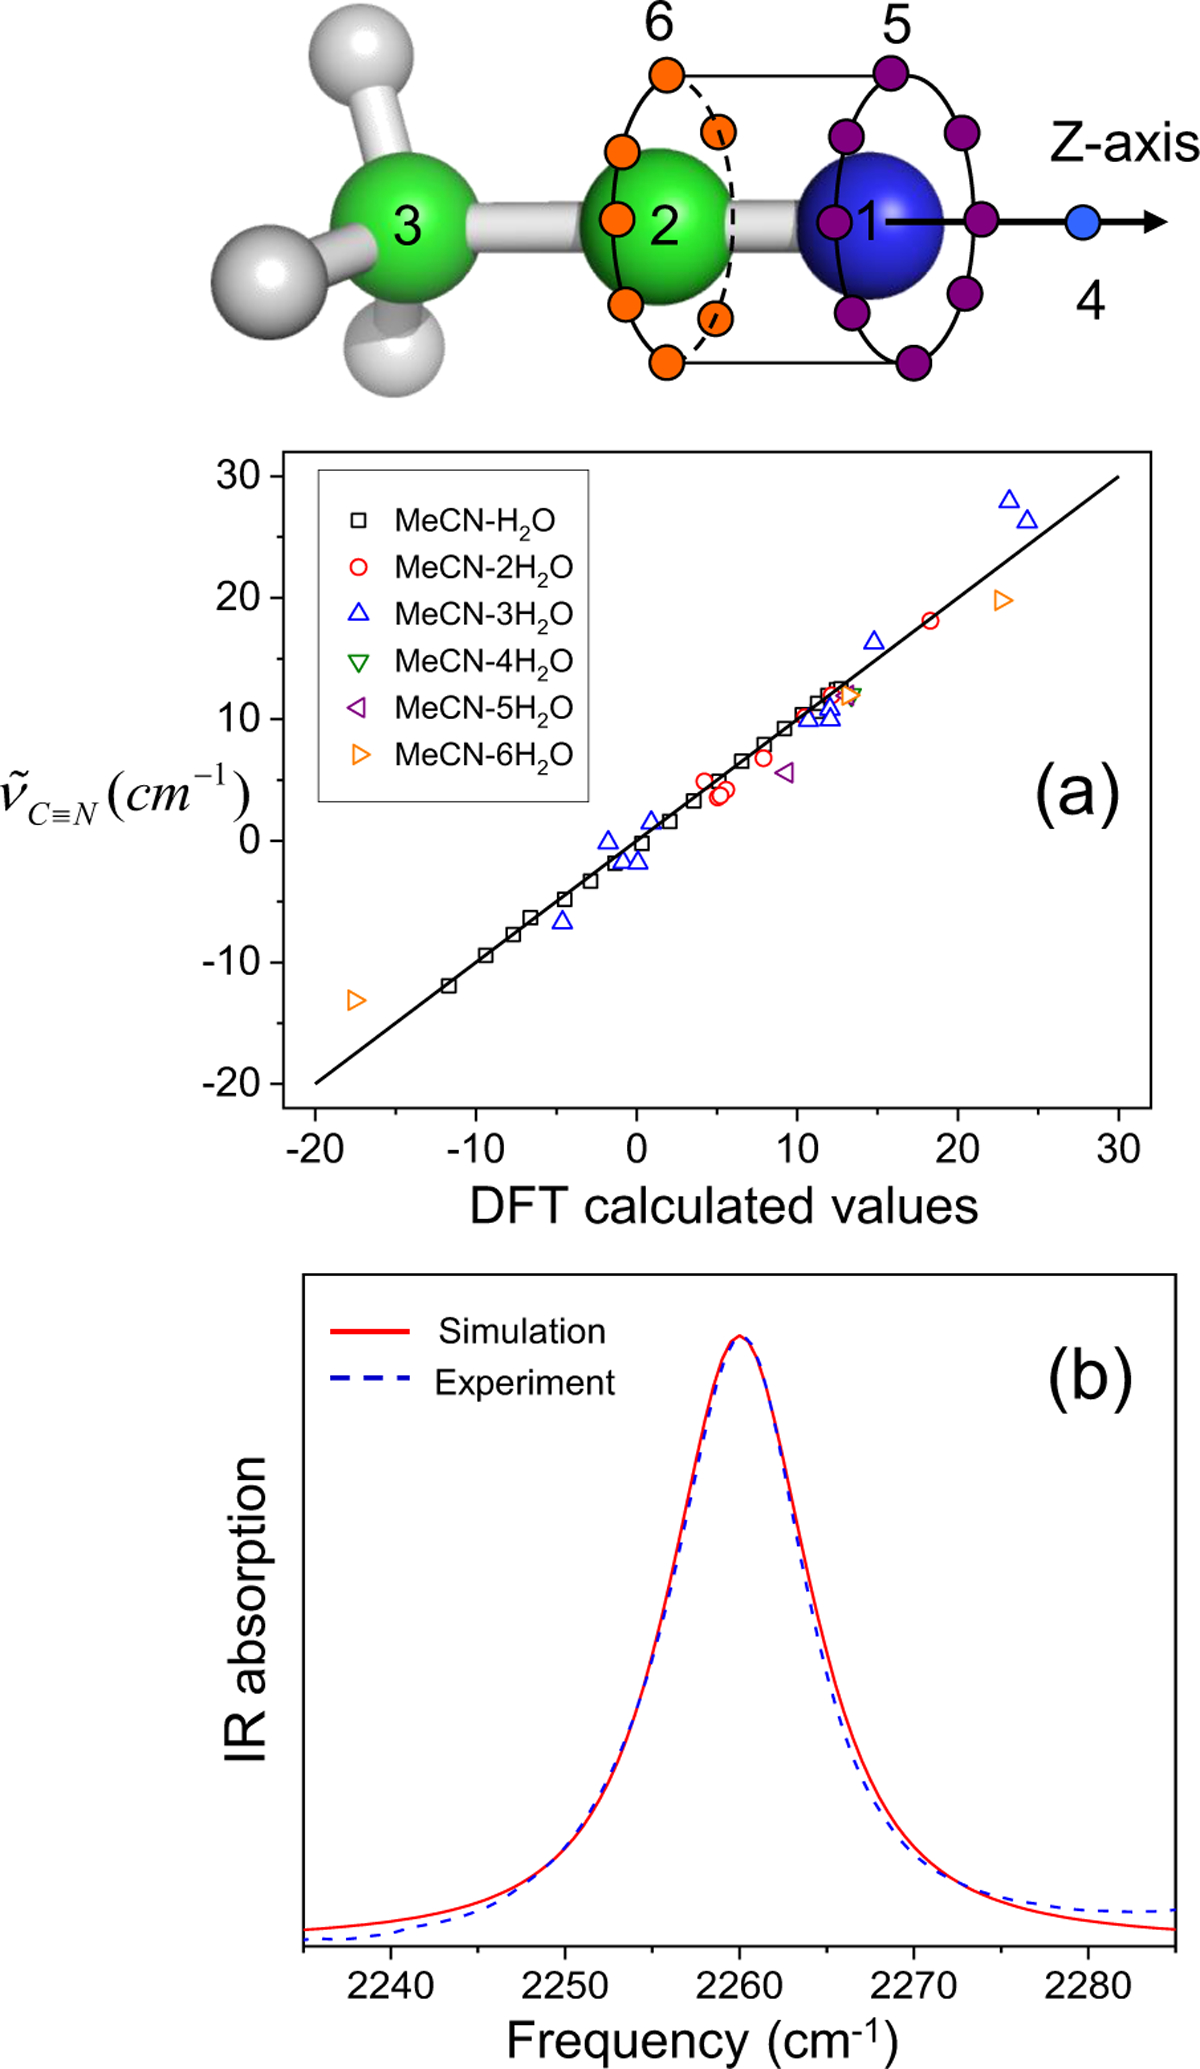
Figure 13.

Solvatochromic charge model with distributed interaction sites for MeCN in the upper panel. The calculated nitrile stretching mode frequency shift using Eq. (109) is directly compared to the DFT calculation results in (a). The numerically simulated IR spectrum of the CN stretch mode (solid red line) is plotted with the experimentally measured result (blue dashed line) in (b). The figure of the interaction sites and (a) is reproduced from Figure 5(a) Ref.183 and (b) is reproduced from Figure 10(a) of Ref.218. Copyright 2008 AIP Puplishing.
