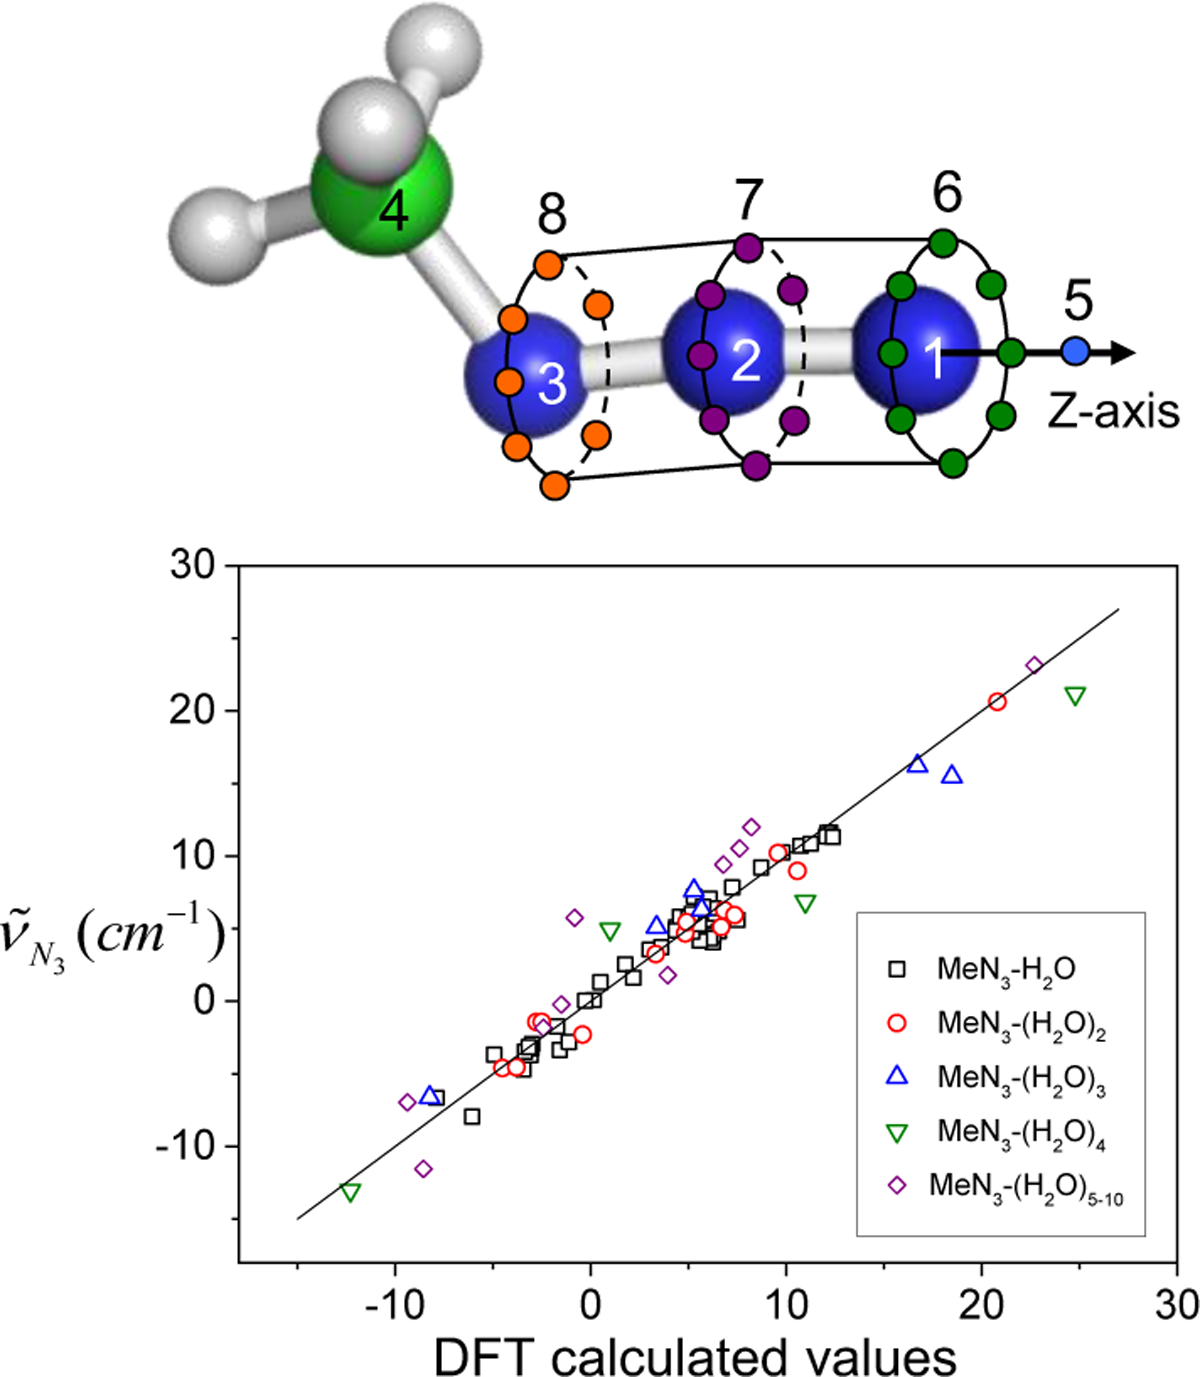
Figure 15.

Solvatochromic charge model with distributed interaction sites for MeN3 in the upper panel. The y-axis in the bottom panel represents the azido stretch mode frequency obtained with Eq. (109) and the x-axis to the DFT calculated results. Reproduced from Figures 4(b) and 5 of Ref.232. Copyright 2008 AIP Puplishing.
