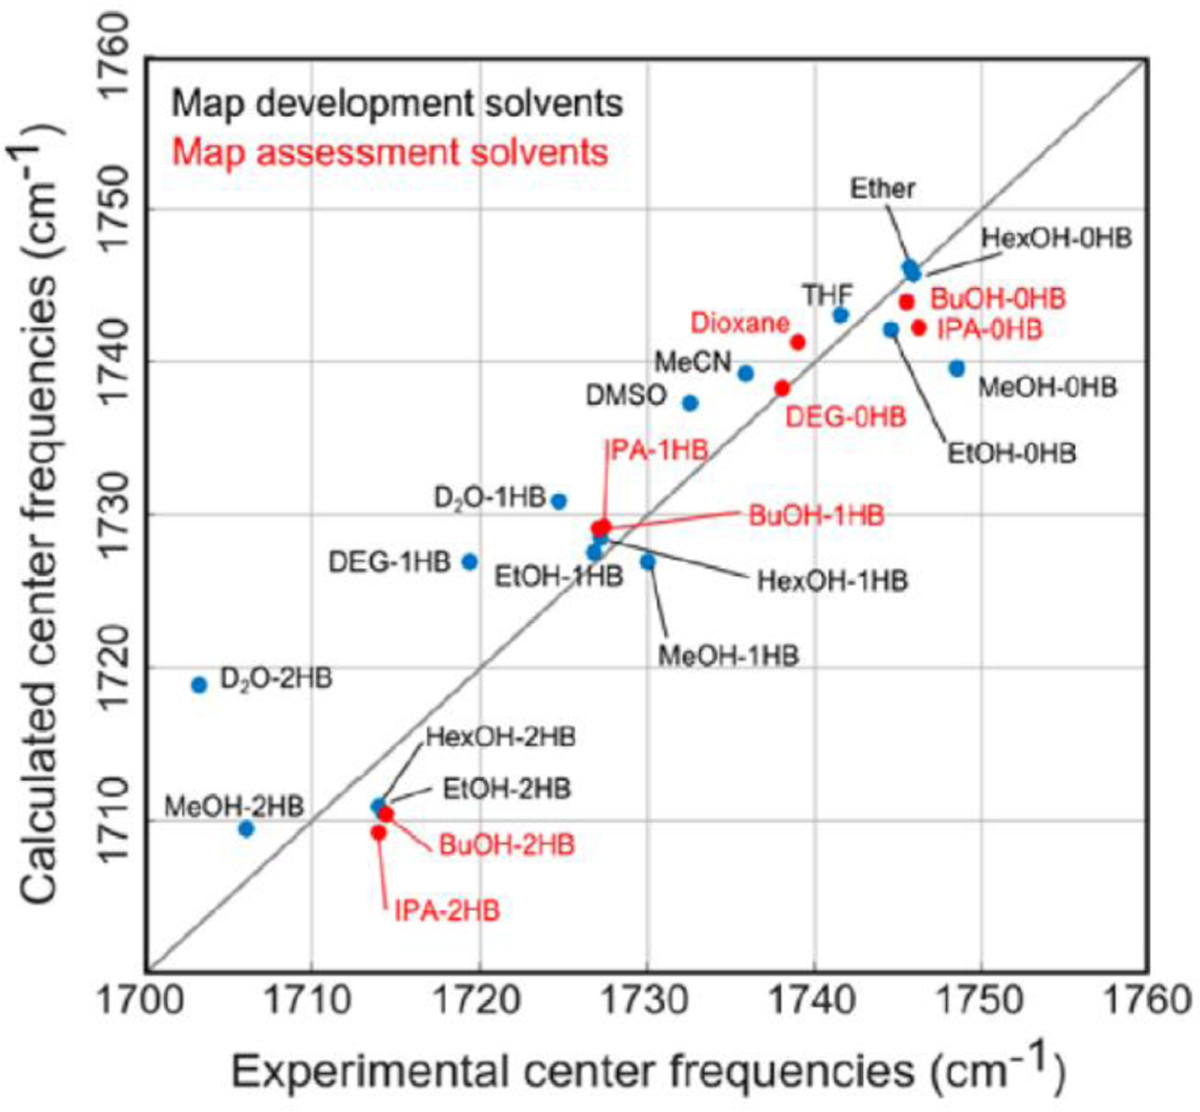
Figure 19.

Comparison between computed and experimental CO center frequencies and line widths in all solvents. Solvents used to parametrize the map are indicated in blue, and solvents used to evaluate the map performance are shown in red. The solvents are labeled Ether = diethyl ether, THF = tetrahydrofuran, MeCN = acetonitrile, HexOH = hexanol, EtOH = ethanol, MeOH = methanol, BuOH = butanol, IPA = isopropanol, and DEG = diethylene glycol. Reproduced from Figure 7 of Ref.366. Copyright 2016 The American Chemical Society.
