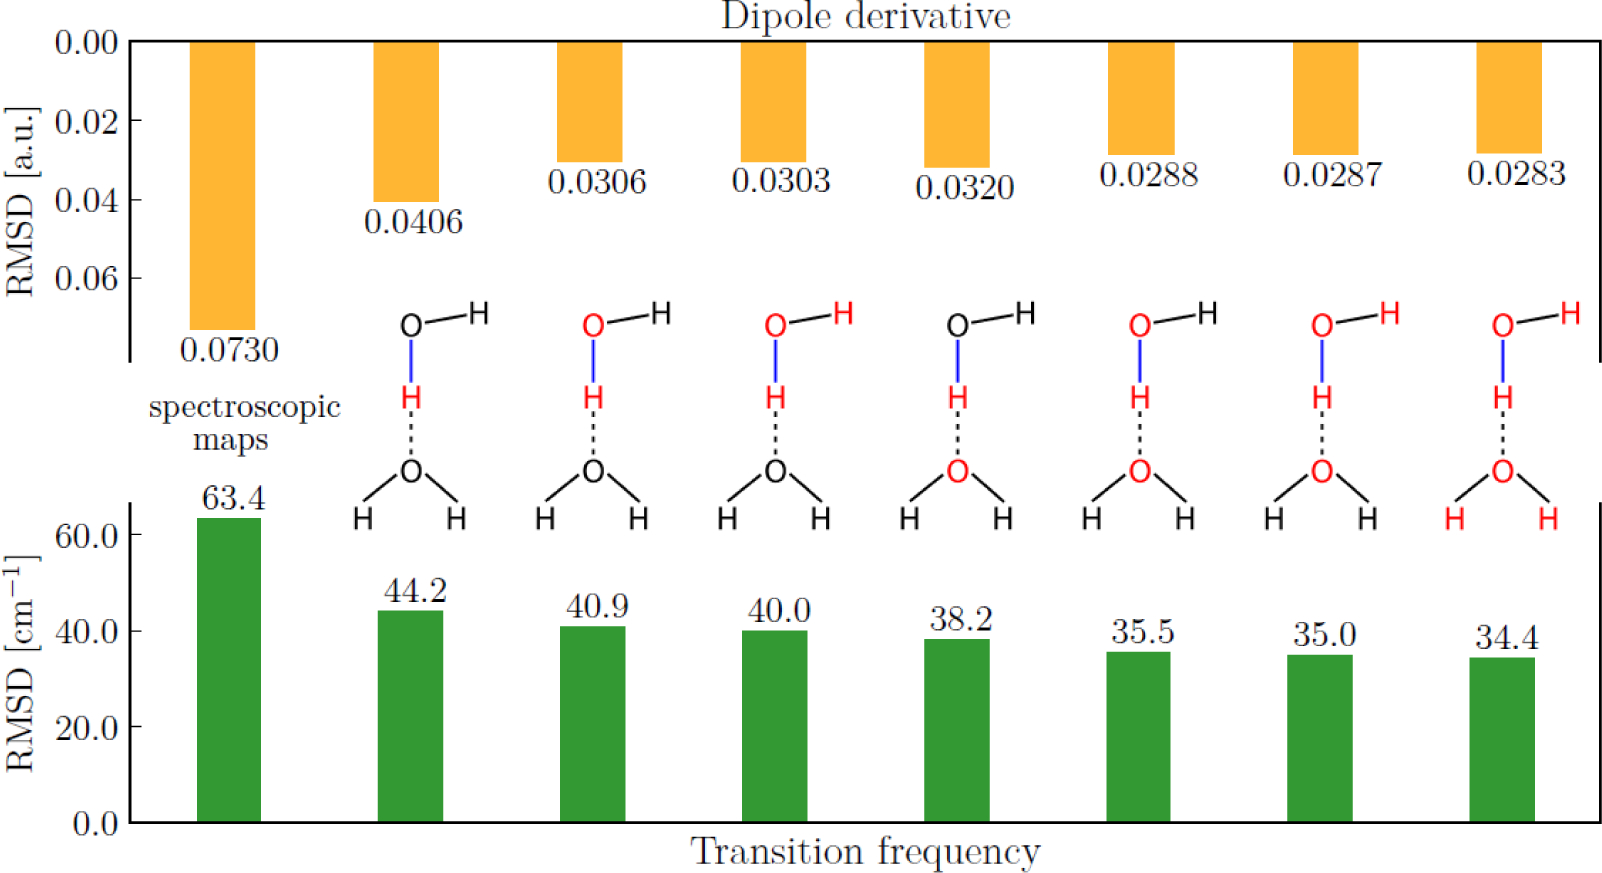
Figure 26.

RMSE in transition frequency and dipole derivative of the OH-stretch (blue line) local mode depending on which atoms’ local chemical environment is used as an input to ANN (marked in red). The leftmost set of bars corresponds to RMSEs of the spectroscopic maps developed in Ref413, all others correspond to the Δ -ML approach of ref. (Adapted from Figure 2 of Ref.414) Copyright 2019 The American Chemical Society.
