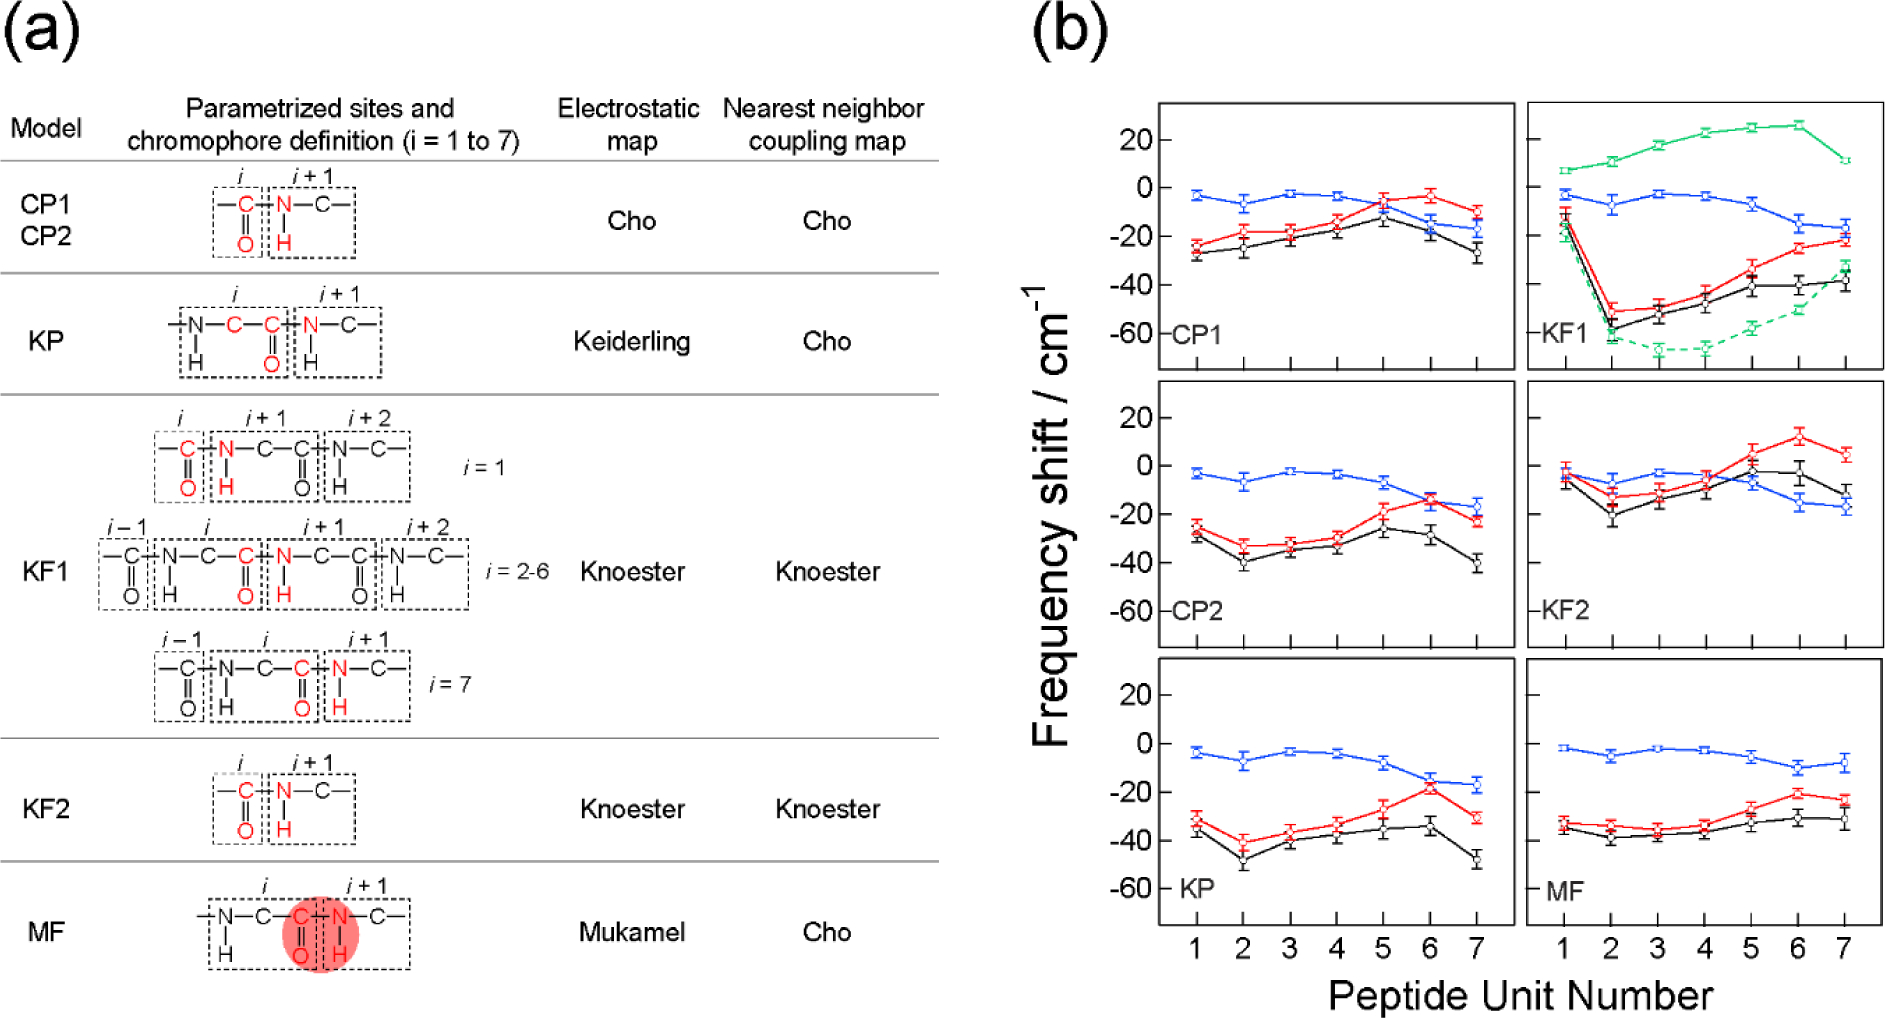
Figure 4.

(a) Summary of the models used for spectral calculations. Parametrized sites are shown in red. The red shading in the MF model schematically indicates the transition charge region for sampling. Cho-Potential model 1 (CP1) utilized parametrized partial charges whereas other models utilize partial charges defined in MD simulations. Knoester-Field model 1 (KF1) utilized NNFS maps. (b) The amide-I local mode frequency shifts calculated with the six models for the restrained trajectory. Blue circles: solvent contributions ; red circles: peptide backbone and side-chain contributions ; black circles: total shifts . The vertical bars indicate the range enclosed by ± one standard deviation (σi). Green symbols with solid and dash lines in KF1 are the NNFS and electrostatic contributions in , respectively. Reproduced from Table 1 and Figure 8 of Ref.216 Copyright 2009 The American Chemical Society.
