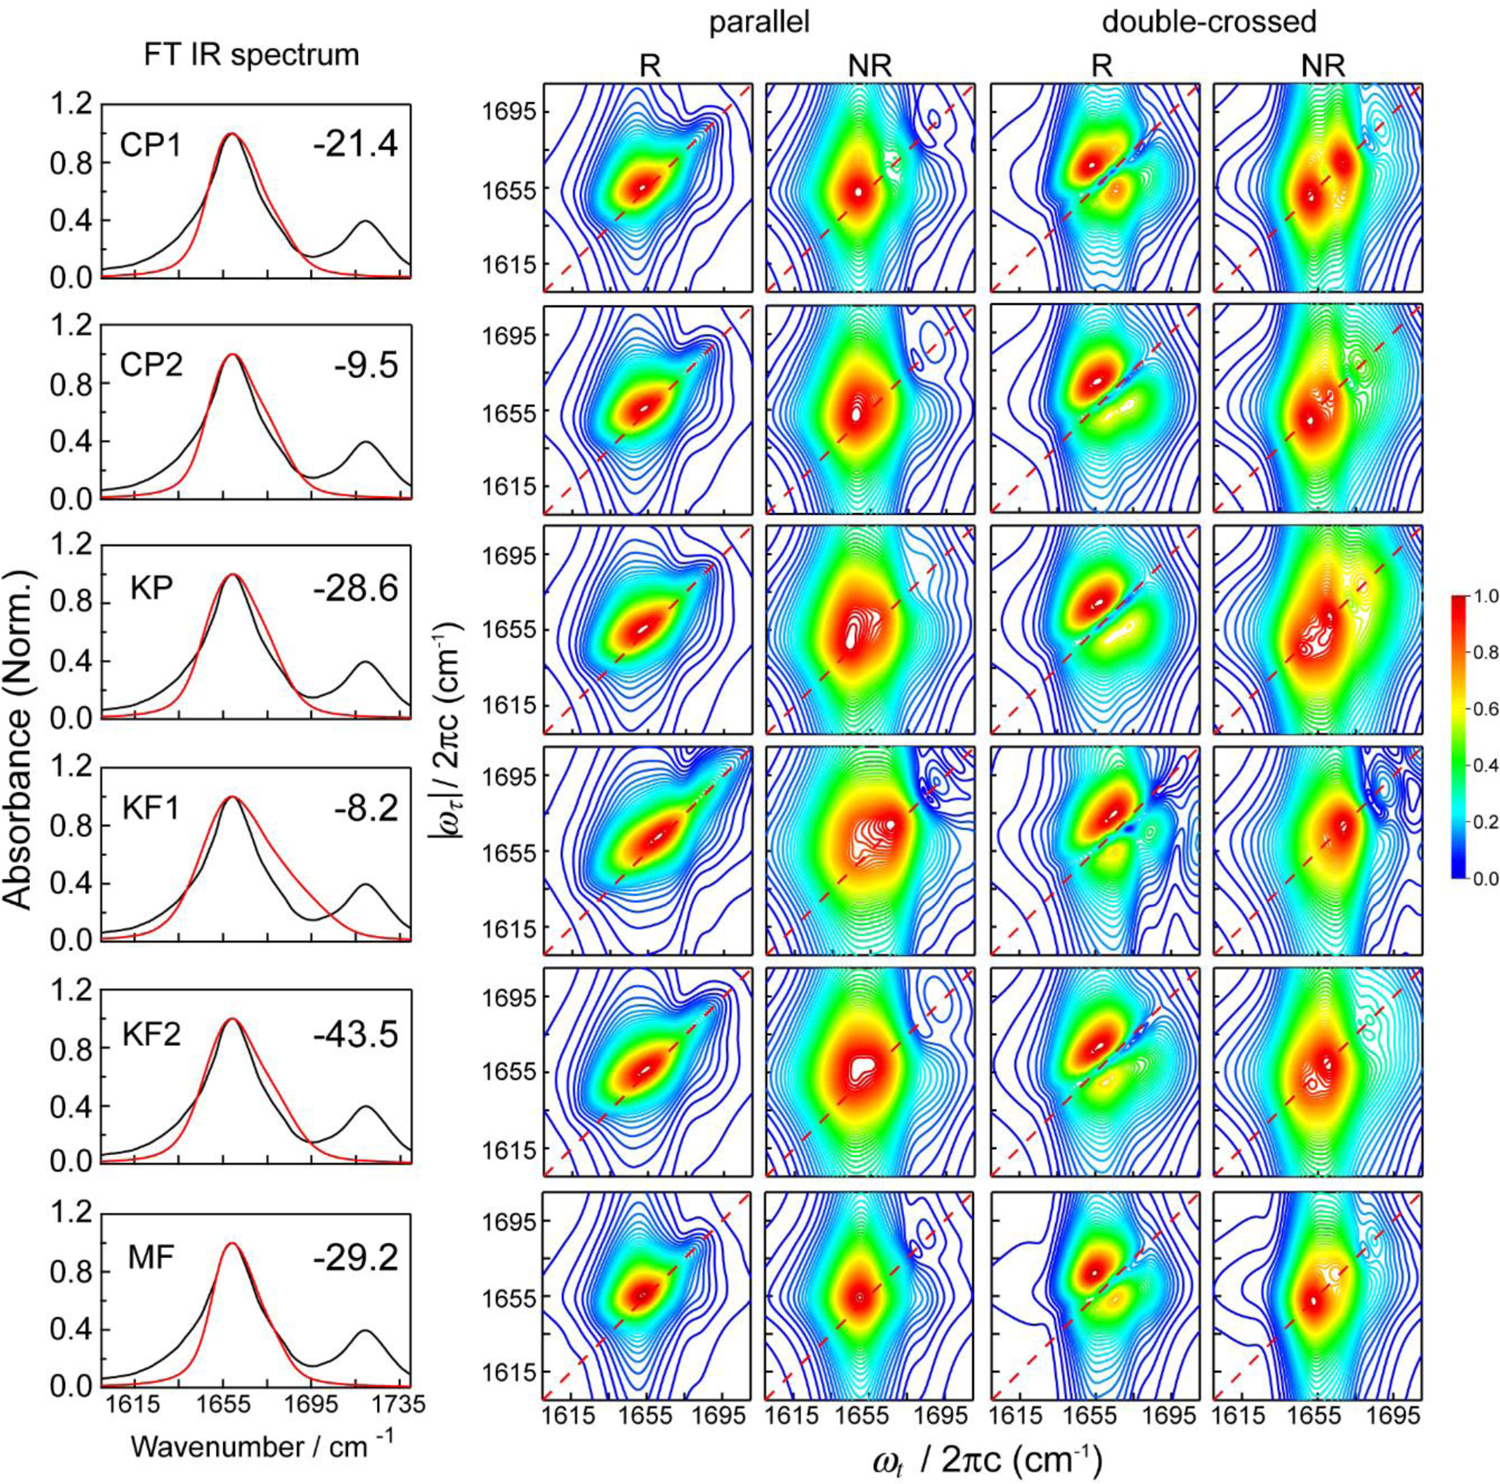
Figure 5.

The linear and 2D IR spectra calculated with the CP1, CP2, KP, KF1, KF2, and MF models for the restrained trajectory. The number in the upper right corner of the FT IR spectrum panel indicates the frequency shift (in cm−1) applied to the calculated spectra. Red and black lines in the linear spectra correspond to the simulated and experimental data, respectively. Reproduced from Figure 7 of Ref.216. Copyright 2009 The American Chemical Society.
