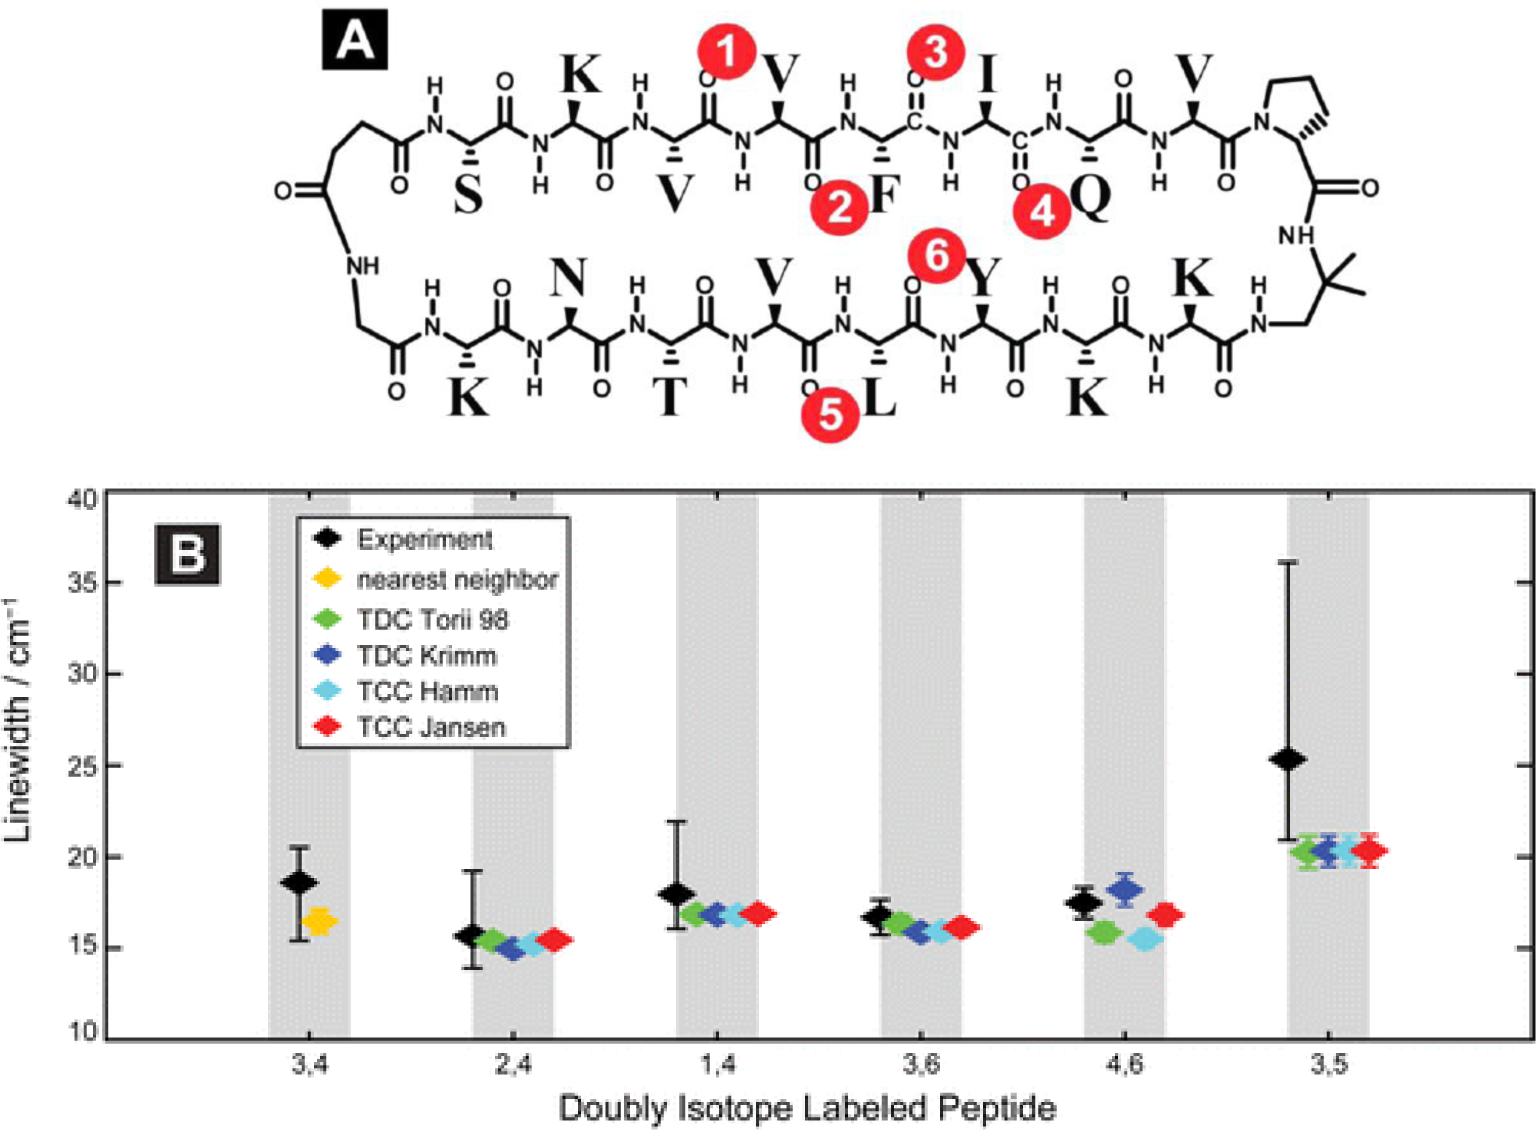
Figure 7.

(A) Sequence of the macrocycle with the isotope labeled positions highlighted. (B) Comparison of experimental and theoretical 2D IR line widths. The theoretical spectra are calculated using various coupling schemes. Reproduced from Figure 1A and Figure 6 of Ref.313 Copyright 2012 American Chemical Society.
