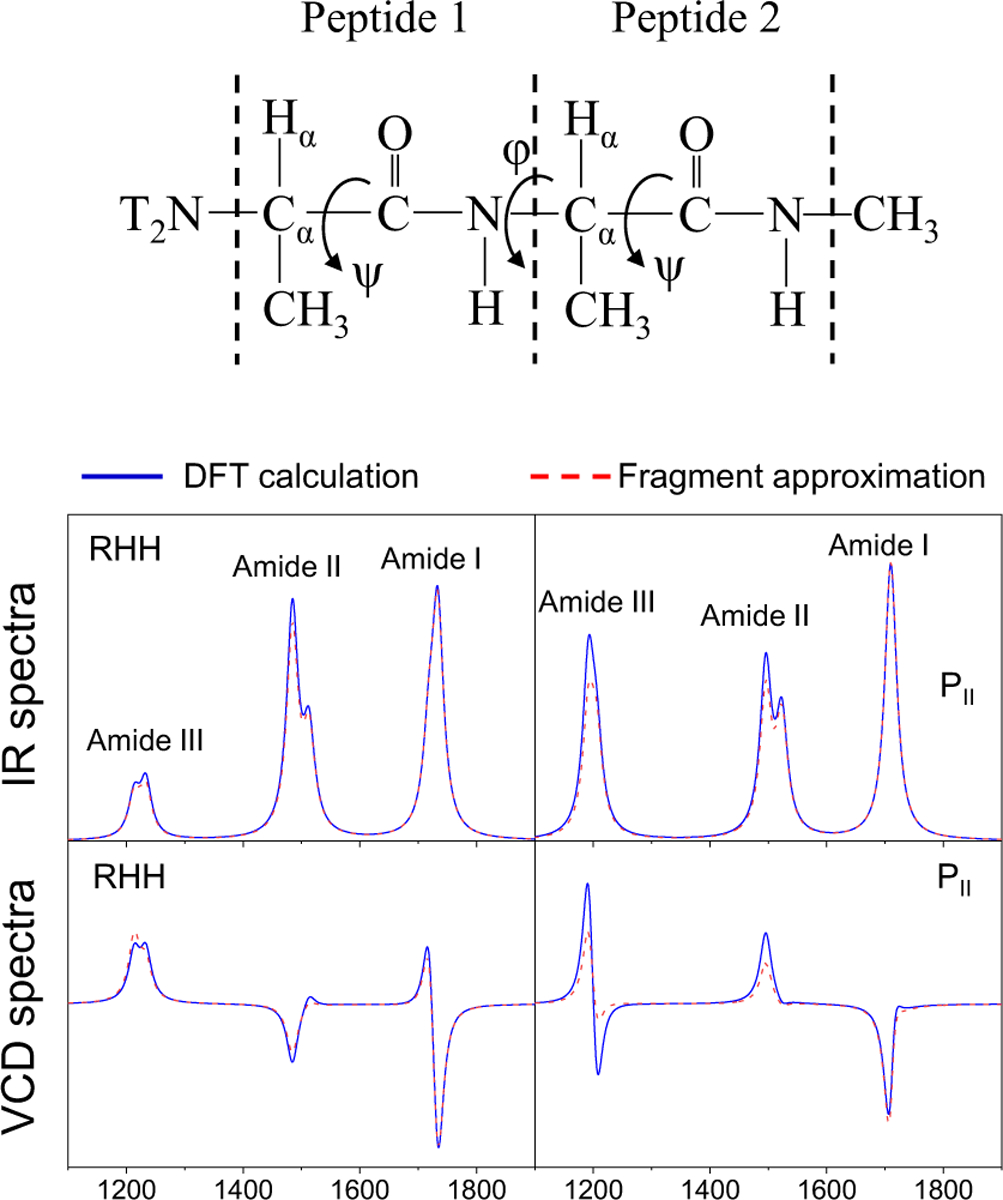
Figure 9.

Molecular structures of alanine dipeptide in the upper panel. IR and VCD spectra of amide I, II, and III modes are displayed for its RHH and PII conformations in the bottom panel. The blue solid and red dashed lines correspond to the simulated spectra obtained from DFT calculation and the fragment approximation, respectively. Reproduced from Figures 1, 3, and 4 of Ref.316. Copyright 2009 Elsevier.
