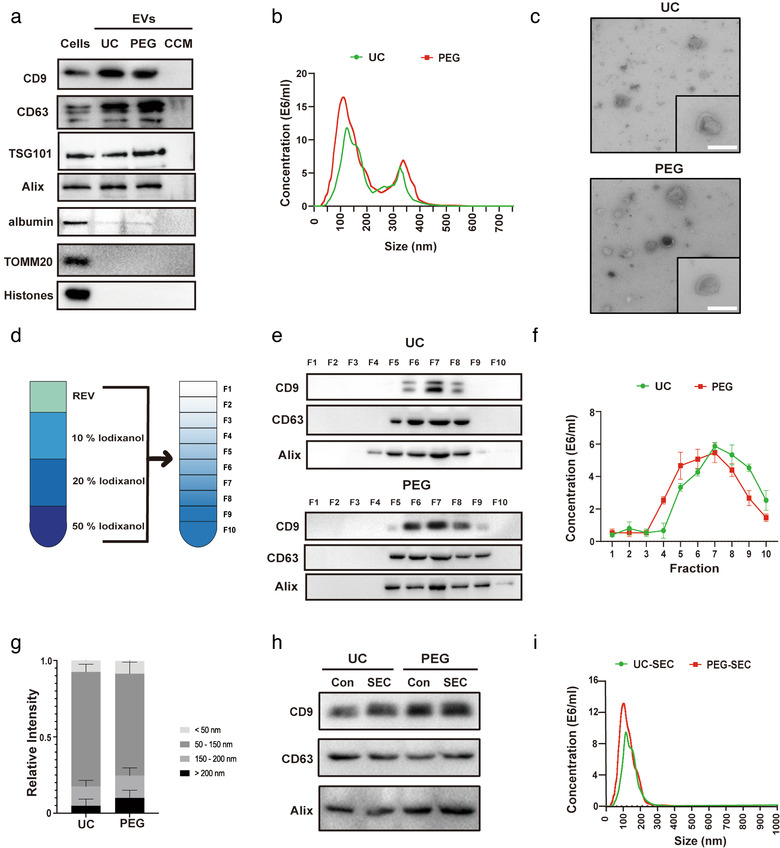
FIGURE 1.

Characterization and purification of ADMSC‐EVs. Adipose‐derived mesenchymal stem cells (ADMSCs) were cultured under standard cell culture conditions, and conditioned cell medium (CCM) was obtained after passage three. CCM was used for the enrichment of extracellular vesicles (EVs) using either the differential centrifugation (i.e. ultracentrifugation, UC) or the polyethylene glycol (PEG) method. (a) Western blot analysis of EVs against exosomal markers of CD9, CD63, TSG101 and Alix, with albumin, TOMM20 and Histones being used as negative markers. Western blots were performed on total cell lysates (cells), EV lysates (UC and PEG) and the CCM. (b) Nanoparticle tracking analysis (NTA) from enriched EVs (UC and PEG) depicting size distribution patterns. (c) Representative transmission electron microscopy (TEM) analysis from EVs enriched by either UC or the PEG method. Scale bar, 100 nm. (d) Resuspended EVs isolated by UC or PEG were allowed to float into an overlayed iodixanol gradient to purify and isolate the small extracellular vesicle (sEV) population. (e) The iodixanol cushion gradient fractions for UC and PEG were analysed by Western blotting (fraction 1–10) using exosome markers. Equivalent volumes of each fraction were loaded per lane. Representative images were shown for CD9, CD63 and Alix which were enriched in fraction seven. (f) NTA was used to assess EV concentrations for each fraction (fraction 1–10). The two‐tailed independent Student's t‐test was used. (g) Representative size distribution of EVs isolated by UC or PEG from their corresponding fraction seven gradients. (h) Western blotting against EV markers (CD9, CD63, and Alix) were performed on ADMSC‐EVs isolated by UC or PEG after (or without, Con) size exclusion chromatography (SEC) purification. (i) The size analysis of SEC purified EVs (UC and PEG) was again done by means of NTA
