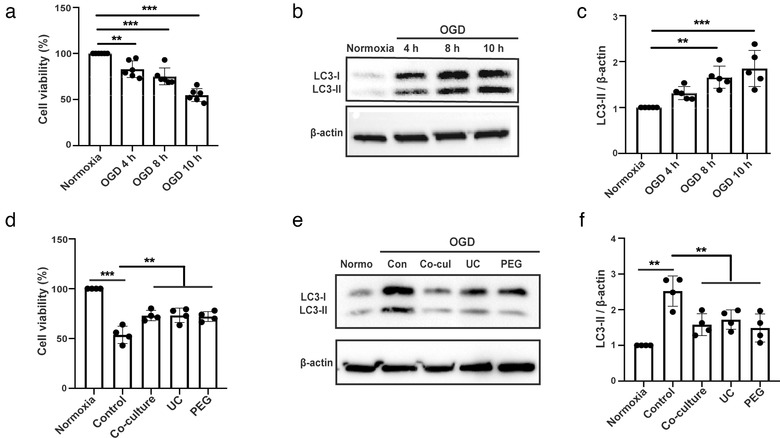
FIGURE 2.

ADMSC‐EVs protect neurons from oxygen‐glucose deprivation (OGD) injury through autophagy regulation. Neuroprotective effects of ADMSC‐EVs in cultivated mouse primary cortical neurons were detected by cell viability assays. Primary neurons were incubated for 4 days as mentioned in the materials and methods part. (a) Cell viability was analysed in primary neurons exposed to 4, 8 and 10 h of OGD followed by 24 h of reoxygenation using the MTT assay (n = 3). Cells incubated under standard cell culture conditions (‘Normoxia’) were defined as 100 % cell survival. (b‐c) Both qualitative and quantitative analysis of autophagy levels as indicated by the abundance of the autophagy associated protein LC3‐II under the aforementioned time points (n = 3). Cells incubated under standard cell culture conditions (‘’Normoxia ’) were used as negative control. (d) The neuroprotective effect of ADMSC‐EVs in cultured primary neurons was evaluated by the MTT assay. After 4 days of cell culture, cells were exposed to 10 h of OGD followed by 24 h of reoxygenation, as mentioned by “OGD” for the later assays. Cell viability was analysed in neurons incubated with either PBS (Control), ADMSCs (Co‐culture) or ADMSC‐EVs (EVs) isolated by UC or PEG after induction of OGD followed by reoxygenation. PBS, ADMSCs and EVs were given at the beginning of both hypoxia and reoxygenation. Cells incubated under standard cell culture conditions (Normoxia) were defined as 100 % cell survival (n = 3). (e‐f) LC3 levels were evaluated by Western blotting in OGD exposed primary neurons treated with ADMSCs (Co‐culture) or ADMSC‐EVs isolated by UC or PEG. ADMSCs and EVs were given at the beginning of both hypoxia and reoxygenation. Neurons treated with PBS under OGD conditions served as positive control (Control). Cells incubated under standard cell culture conditions (Normoxia) were used as negative control (n = 3). A representative Western blot is shown in (e), whereas the quantitative analysis for LC3‐II is shown in (f). One‐way ANOVA followed by the Tukey's post‐hoc‐test was used. Data are shown as mean ± SD. Data are statistically different from each other with *P < 0.05, **P < 0.01, and ***P < 0.001
