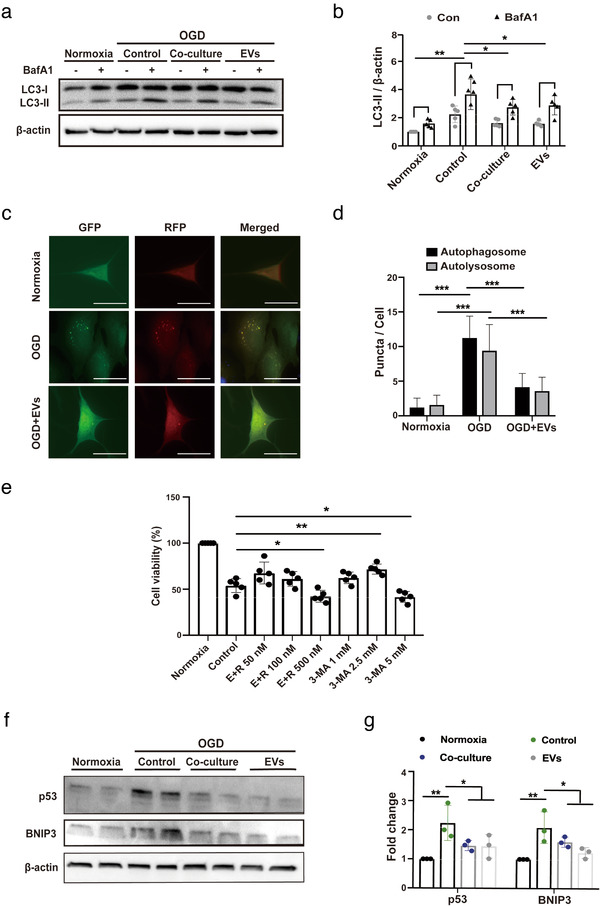
FIGURE 3.

ADMSC‐EVs inhibit autophagic flux and increase cell viability through p53 and BNIP3 signalling. (A‐B) Assessment of the autophagic flux was done using bafilomycin A1 (BafA1) in the aforementioned groups (Normoxia, Control, Co‐culture and EVs). BafA1 was added 3 h before harvesting the cells. LC3 levels were evaluated again by Western blotting in the presence of DMSO or BafA1 (n = 3). Quantitative analysis of LC3‐II blotting is shown in (b). (c‐d) Autophagosomes (yellow) and autolysosomes (red) were detected in OGD‐exposed primary neurons that express mRFP‐GFP‐LC3. The neurons were treated with PBS or ADMSC‐EVs. PBS and EVs were given at the beginning of hypoxia and reoxygenation. Cells incubated under standard cell culture conditions (Normoxia) were used as negative control. Scale bar, 10 μm. The number of autophagosomes and autolysosomes in each cell (20‐30 cells per group) was quantified in (d) (n = 3). (e) The impact of autophagy on neuronal survival after OGD was evaluated using different concentrations of the autophagy inhibitor 3‐MA in comparison to neurons treated with the solvent DMSO using the MTT assay. ADMSC‐EVs together with different concentrations of the autophagy stimulator rapamycin (E+R; n = 3) were also used on primary neurons exposed to OGD. All the drugs were given twice, at the beginning of hypoxia and reoxygenation. Cells incubated under standard cell culture conditions (Normoxia) were defined as 100 % cell survival. (f‐g) Both p53 and BNIP3 were evaluated by Western blotting in OGD exposed primary neurons treated with PBS, ADMSCs (Co‐culture) or ADMSC‐EVs (EVs). Neurons treated with PBS under OGD conditions served as positive control (Control). Cells incubated under standard cell culture conditions (Normoxia) were used as negative control (n = 3). EVs were given at the beginning of hypoxia and reoxygenation. The quantitative analysis of p53 and BNIP3 Western blotting is shown in (g). One‐way ANOVA followed by the Tukey's post‐hoc‐test, data are given as mean ± SD. Data are statistically different from each other with *P < 0.05, **P < 0.01, and ***P < 0.001
