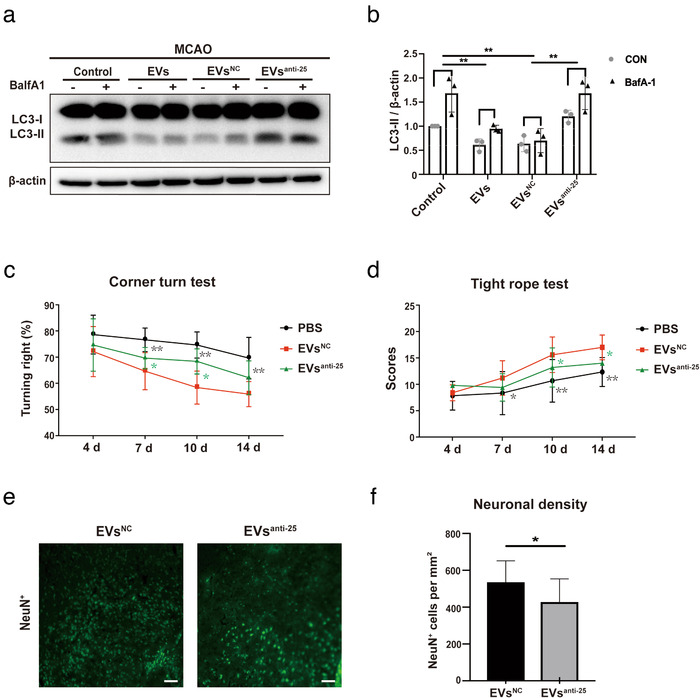
FIGURE 7.

Loss of miR‐25‐3p in ADMSC‐EVs diminishes post‐stroke EV‐induced regulation of autophagy and neuroprotection. (a‐b) The autophagic flux was evaluated with BafA1 in MCAO (middle cerebral artery occlusion) mice that either received PBS or ADMSC‐EVs 12 h after the induction of ischemic stroke, including ADMSC‐EVs, ADMSC‐EVsNC, and ADMSC‐EVsanti‐miR‐25 (n = 6 per group). BafA1 was injected 3 h before sacrifice. Quantitative analysis of LC3‐II is shown in (b). (c‐d) Motor coordination was evaluated by the tight rope test and by the corner turn test at four, seven, ten and fourteen days after cerebral ischemia to verify the effects of ADMSC‐EVsNC and ADMSC‐EVsanti‐miR‐25 in MCAO animals compared to PBS group. In the corner turn test, the EVsNC group showed improvement on day seven, ten and fourteen compared with PBS control group. The EVsNC group showed improvement on day seven and day ten compared to the EVsanti‐miR‐25 group. EVsNC group showed significant improvement in the tight rope test compared to the PBS control group. EVsNC groups also showed significant better tight rope performance compared to EVsanti‐miR‐25 on day ten and fourteen. (e‐f) The neuronal density in ADMSC‐EVsNC and ADMSC‐EVsanti‐miR‐25 was measured on day fourteen as indicated by NeuN staining within the ischemic lesion site (n = 10 per group). The quantitative analysis of neuronal density is shown in (f). Scale bars, 50 μm. The two‐tailed independent Student's t‐test was used in. One‐way ANOVA followed by the Tukey's post‐hoc‐test was used except for F, data are shown as mean ± SD. Data are statistically different from each other with *P < 0.05, **P < 0.01, and ***P < 0.001
