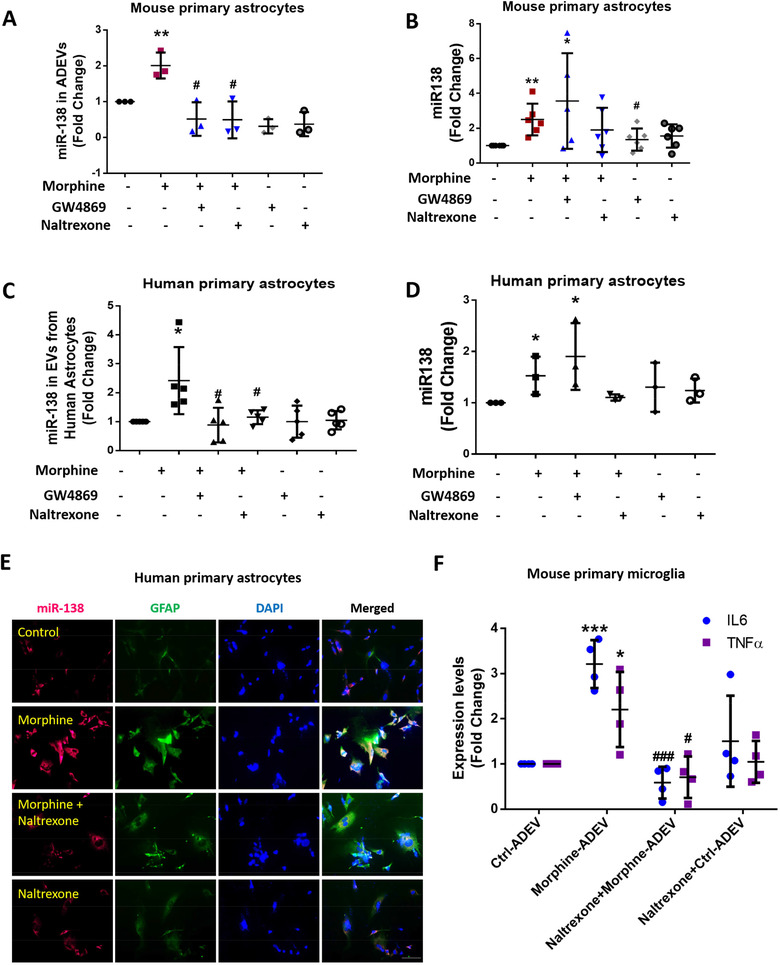
FIGURE 2.

Morphine‐induced upregulation of miR138 in ADEVs involves mu receptor. (A) Real‐time PCR analysis of miR138 expression in EVs isolated from mouse primary astrocytes pretreated with the exosome release inhibitor GW4869 (10 μM) or mu receptor antagonist, Naltrexone (10 μM), followed by morphine exposure for additional 24 h. One‐way ANOVA followed by Bonferroni's post hoc test was used to determine the statistical significance among multiple groups (n = 3). (B) Real‐time PCR analysis of miR138 expression in mouse primary astrocytes pretreated with the exosome release inhibitor GW4869 (10 μM) or mu receptor antagonist Naltrexone (10 μM), followed by morphine exposure for additional 24 h. One‐way ANOVA followed by Bonferroni's post hoc test was used to determine the statistical significance among multiple groups (n = 6). (C)Real‐time PCR analysis of miR138 expression in EVs isolated from human primary astrocytes pretreated with exosome release inhibitor GW4869 (10 μM) or mu receptor antagonist Naltrexone (10 μM), followed by morphine exposure for additional 24 h. One‐way ANOVA followed by Bonferroni's post hoc test was used to determine the statistical significance among multiple groups (n = 5). (D) Real‐time PCR analysis of miR138 expression in human primary astrocytes pretreated with exosome release inhibitor GW4869 (10 μM) or mu receptor antagonist Naltrexone (10 μM), followed by morphine exposure for additional 24 h. One‐way ANOVA followed by Bonferroni's post hoc test was used to determine the statistical significance among multiple groups (n = 3). (E) Representative images of ISH assay using a probe specific for miR‐138 (red) combined with an immunostaining for astrocyte marker GFAP (green) in human primary astrocytes. Scale bar, 10 μm (n = 3). (F) Real‐time PCR analysis of IL‐6 / TNFα mRNA expression in mouse primary microglia exposed to Morphine‐ADEV isolated from astrocytes pretreated with mu receptor antagonist Naltrexone (10 μM), followed by morphine exposure for additional 24 h. One‐way ANOVA followed by Bonferroni's post hoc test was used to determine the statistical significance among multiple groups (n = 4). All data are presented as mean ± SD or SEM of at least three individual experiments. *,P < 0.05; **,P < 0.01; ***,P < 0.001 versus control group. #,P < 0.05; ###,P < 0.001 versus morphine group.
