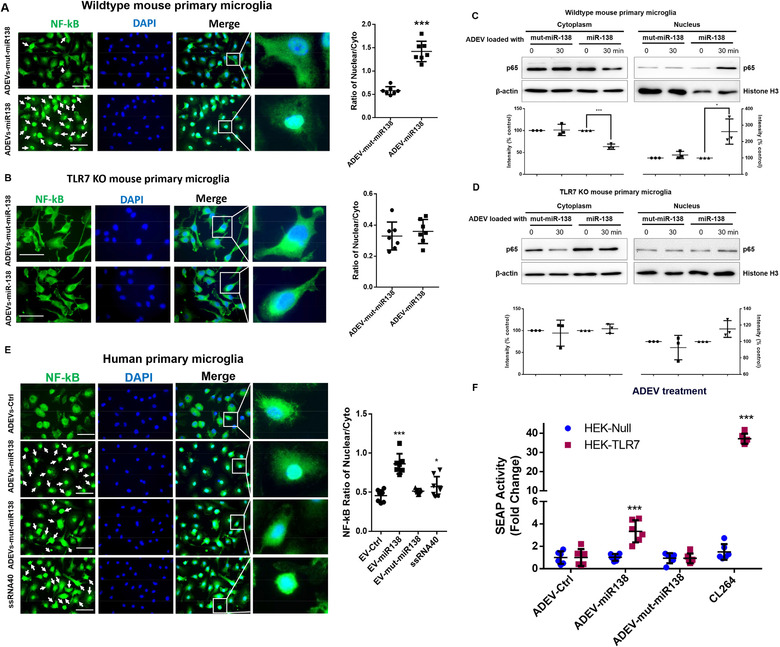
FIGURE 4.

ADEV miR‐138 induces nuclear translocation of NF‐κB p65 involving TLR7. (A) Wild type mouse microglial cells were exposed to ADEVs‐miR‐138 or ADEVs‐mut‐miR‐138, followed by immunostaining with antibody specific for NF‐κB. Bars, 30 μm. White arrows, NF‐κB nuclear translocated cells. The quantification of NF‐κB fluorescence intensity in the nucleus versus non‐ nucleus (n = 3, three images were analyzed for each experiment). (B) TLR7 KO mouse microglial cells were exposed to either ADEVs‐miR‐138 or ADEVs‐mut‐miR‐138, followed by immunostaining with antibody specific for NF‐κB. Bars, 10 μm. The quantification of NF‐κB fluorescence intensity in the nucleus versus non‐ nucleus (n = 3, three images were analyzed for each experiment). (C) Representative western blot and quantification results of NF‐κB p65 in the lysates of nuclear and cytoplasmic fractions isolated from wild type mouse microglial cells exposed to ADEVs‐miR‐138 or ADEVs‐mut‐miR‐138 for 30 min (n = 3). (D) Representative western blot and quantification results of NF‐κB p65 in the nuclear and cytoplasmic fractions isolated from TLR7 KO mouse microglial cells exposed to ADEVs‐miR‐138 or ADEVs‐mut‐miR‐138 for 30 min (n = 3). (E) Human primary microglial cells were exposed to ADEVs‐miR‐138, ADEVs‐mut‐miR‐138 or ADEVs‐ssRNA40 (ssRNA40, TLR7 RNA agonist), followed by immunostaining with antibody specific for NF‐κB p65. Bars, 30 μm. White arrows: cells with NF‐κB p65 translocation in the nucleus. The quantification of NF‐κB fluorescence intensity in the nucleus versus non‐ nucleus (n = 3, three images were analyzed for each experiment). (F) SEAP activity in HEK‐Null / HEK‐TLR7 cells exposed to ADEVs‐miR‐138 or ADEVs‐mut‐miR‐138 or CL264 (n = 3, two wells were analyzed for each experiment). All data are presented as mean ± SD or SEM of three independent experiments. *,P < 0.05; **,P < 0.01; ***,P < 0.001 versus control group.
