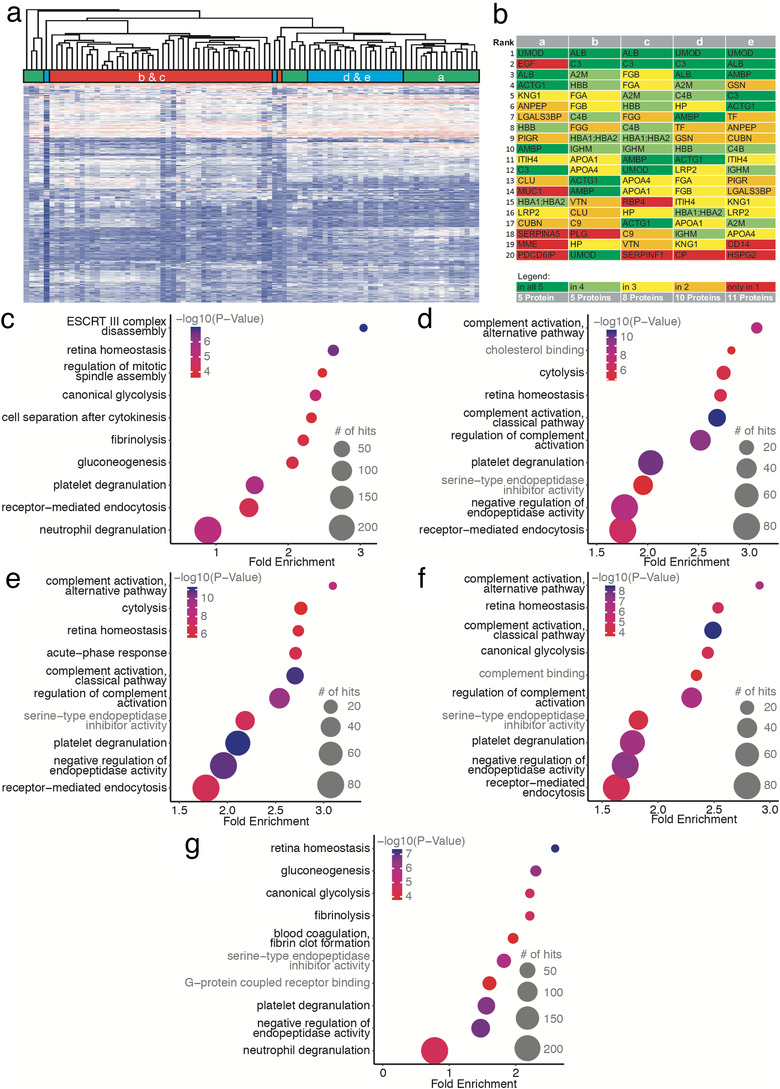
FIGURE 2.

The suEV proteome clusters depending on the collection timepoint throughout living donor kidney transplantation. Hierarchical clustering of all single sample protein measurements of the first cohort (a). Top 20 annotated proteins for each timepoint of sample collection (b). Bubble plots of top 10 significant GO terms for each timepoint of sample collection. P value depicted as color code, number of annotated proteins corresponding to bubble size, black GO terms indicating biological processes, gray GO terms indicating molecular function. (c: Timepoint A – donor sample, D: Timepoint B – day 0, E: Timepoint C – day 1, F: Timepoint D – 1 month, G: Timepoint E – 1 year)
