Fig. 2.

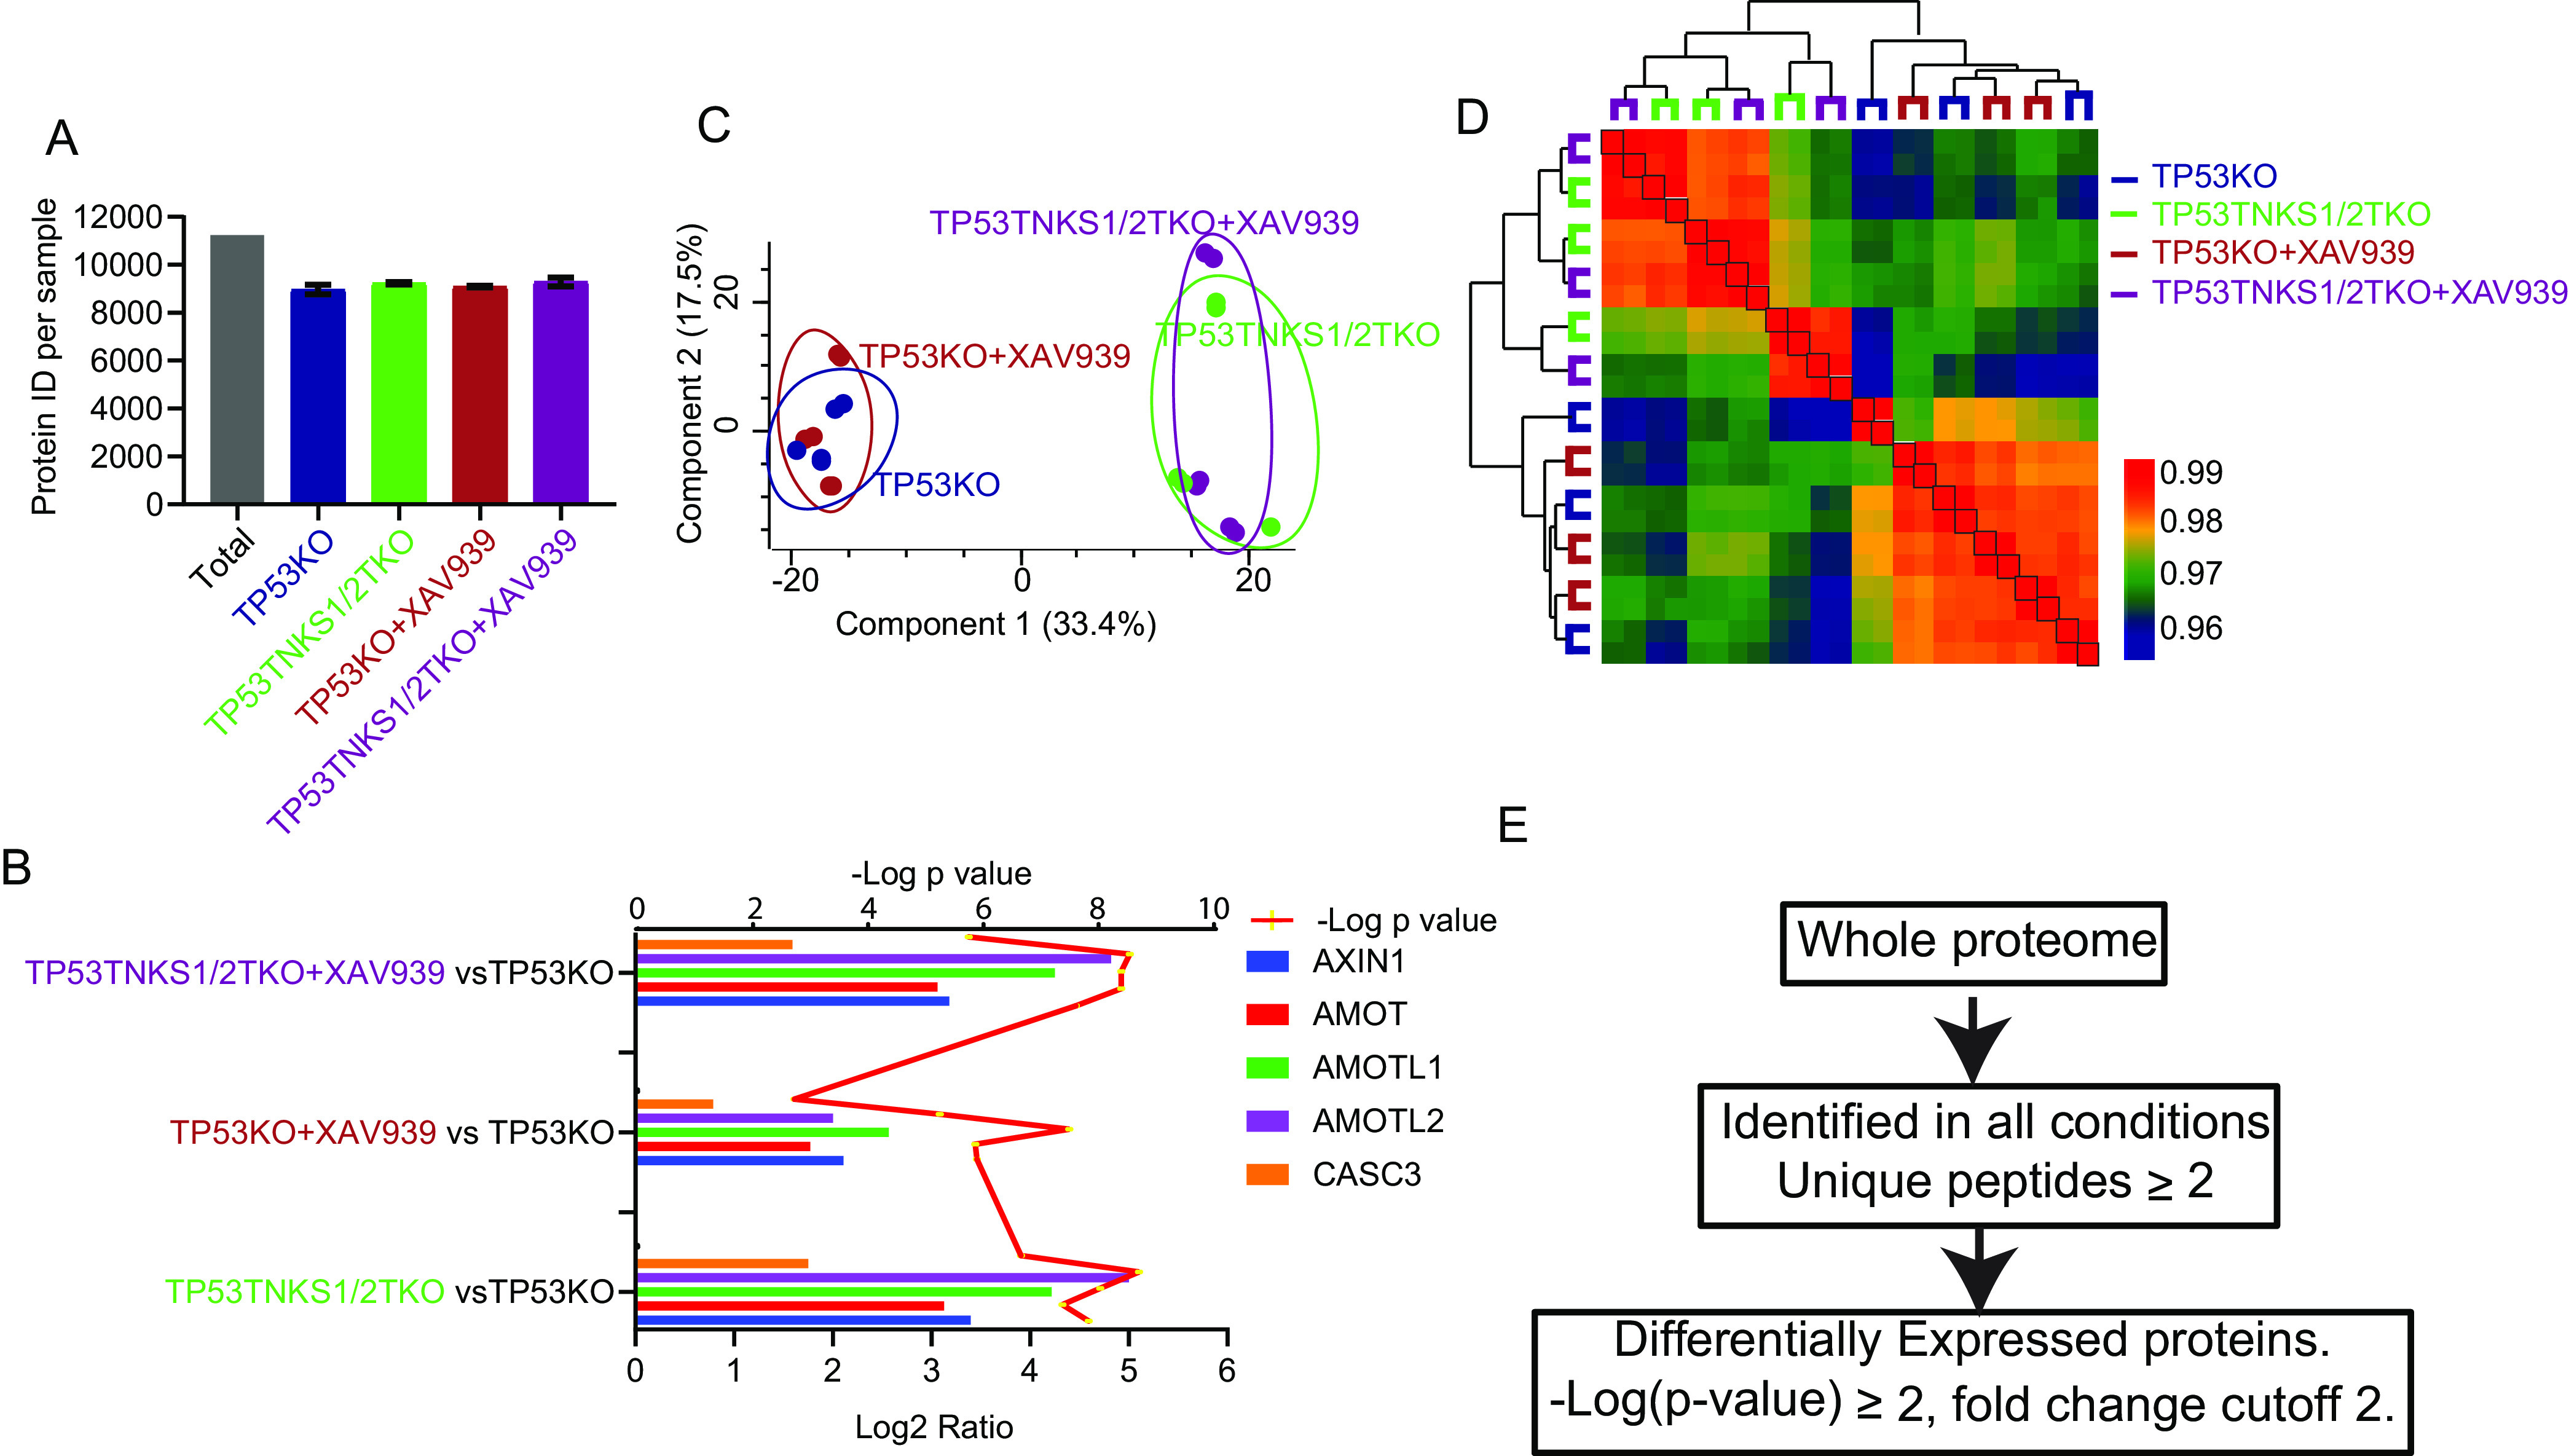
Label-free quantitative proteomics analysis of TNKS1/2DKO cells. A, The number of total quantified proteins of each sample in TNKS1/2DKO data set. B, The known substrates of TNKS1/2 and RNF146 were used as positive controls, as shown by the Log2 ratio in the RNF146 KO data set. The y axis was shown for each condition compared with those in TP53KO cells. The line was shown for t test p value. C, Samples in the TNKS1/2 DKO data set were separated into 2 parts (WT and KO) by 2-dimensional principle component analyses. D, Heatmap shows the Pearson correlation among biological replicates and unsupervised clustering of samples in TNKS1/2DKO data set. E, Outline of analysis in which proteins were significantly and differentially expressed in each data set.
