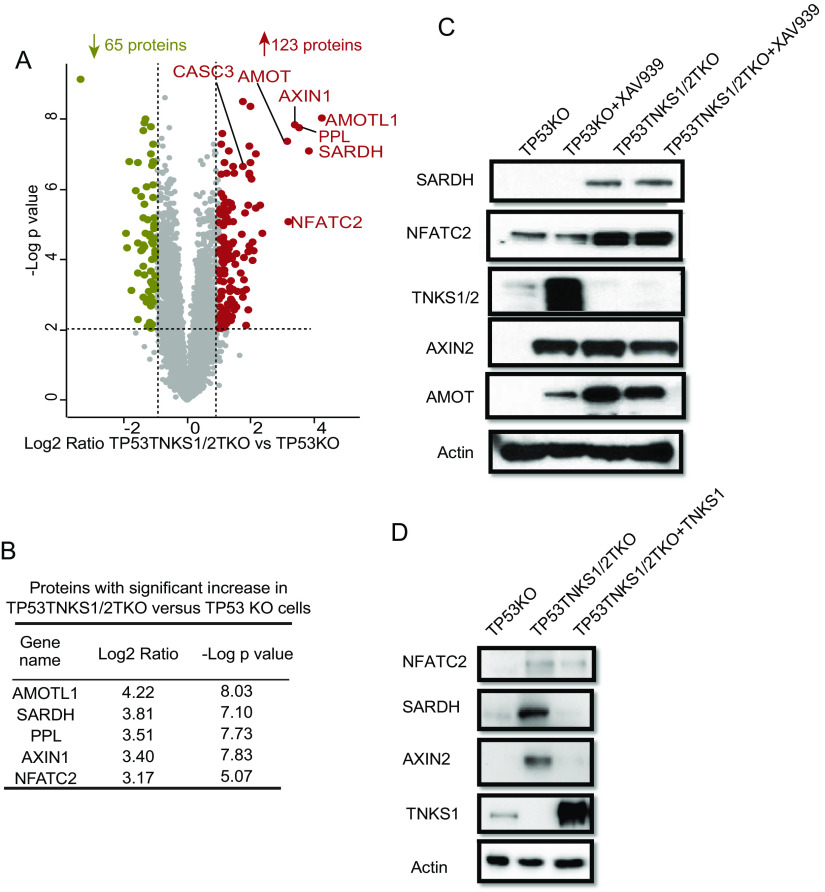
Fig. 3.
Protein changed by double knockout of TNKS1/2. A, Volcano plot shows the significant change in differentially expressed proteins in TP53TNKS1/2TKO versus TP53KO cells. Each dot represents a protein. The brown and olive dot indicate significantly upregulated and downregulated proteins, respectively. The known substrates of TNKS1/2 are labeled with gene names. y axis is the –Log p-value, and x axis is the Log2 fold change. Tests were performed using a t test filtered by p-value ≤ 0.01, a fold change cutoff of 2 and unique peptide ≥ 2. B, The top 5 upregulated proteins in TP53TNKS1/2TKO versus TP53KO cells shown with Log2 fold change and –Log p value. C, Immunoblot assay of whole cell extracts for SARDH and NFATC2 in TP53KO and TP53TNKS1/2TKO cells plus XAV939 treatment (10 μm, 24 h). TNKS1/2, AMOT, and AXIN2 were used as positive controls, and β-actin was used as the loading control. D, Reintroduction of TNKS could rescue the overexpression of SARDH and NFATC2.

