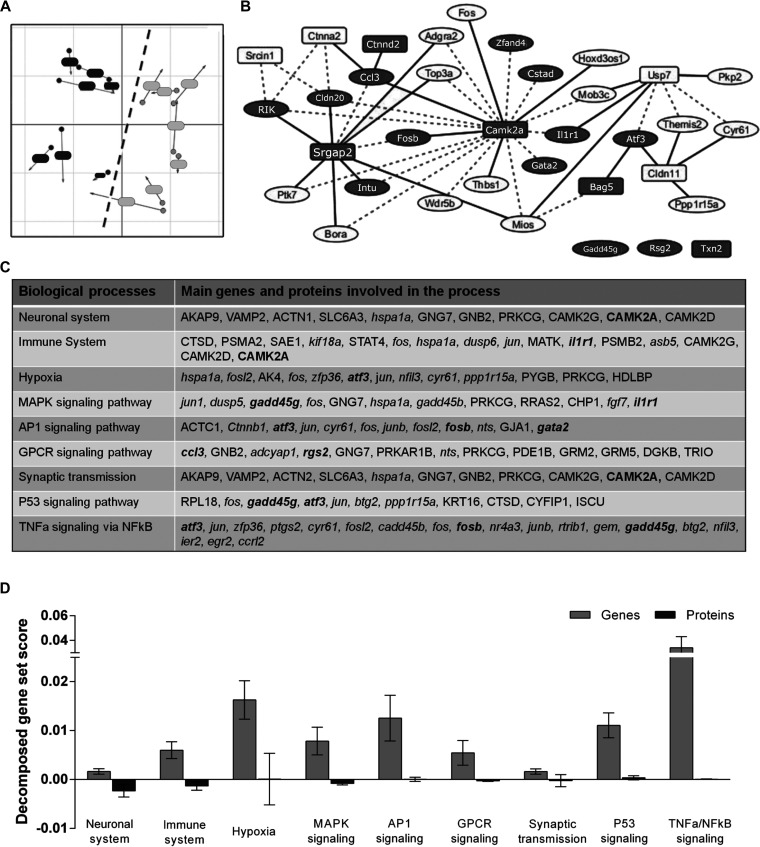
Fig. 2.
Integrative analysis of transcriptomic and proteomic data from the mouse ischemic brain. A, Multiple co-inertia analysis (MCIA), distribution of samples based on their transcriptomic (dot) and proteomic (arrow) information for CL (dark gray) and IP (light gray) samples. Circle and arrows from each sample are joined by a line, the length of which is proportional to the divergence between those samples in the two data sets. B, Relevance network of top correlations between genes (circles) and proteins (rectangles). Dashed lines indicate positive correlations; continuous lines indicate negative correlations. Selected candidates for replication are marked in dark grey. C, Altered biological processes and signaling pathways in which the selected candidates (in bold) are involved. Genes are indicated in italics; proteins are shown in regular type. D, Decomposed gene set score (GSS) of the most outstanding intracellular signaling pathways weighted for genes (light grey) and proteins (dark grey). Means and 95% of confidence intervals are depicted in bar graphs. The higher decomposed GSS, the larger contribution of the data set to the specific process or pathway.

