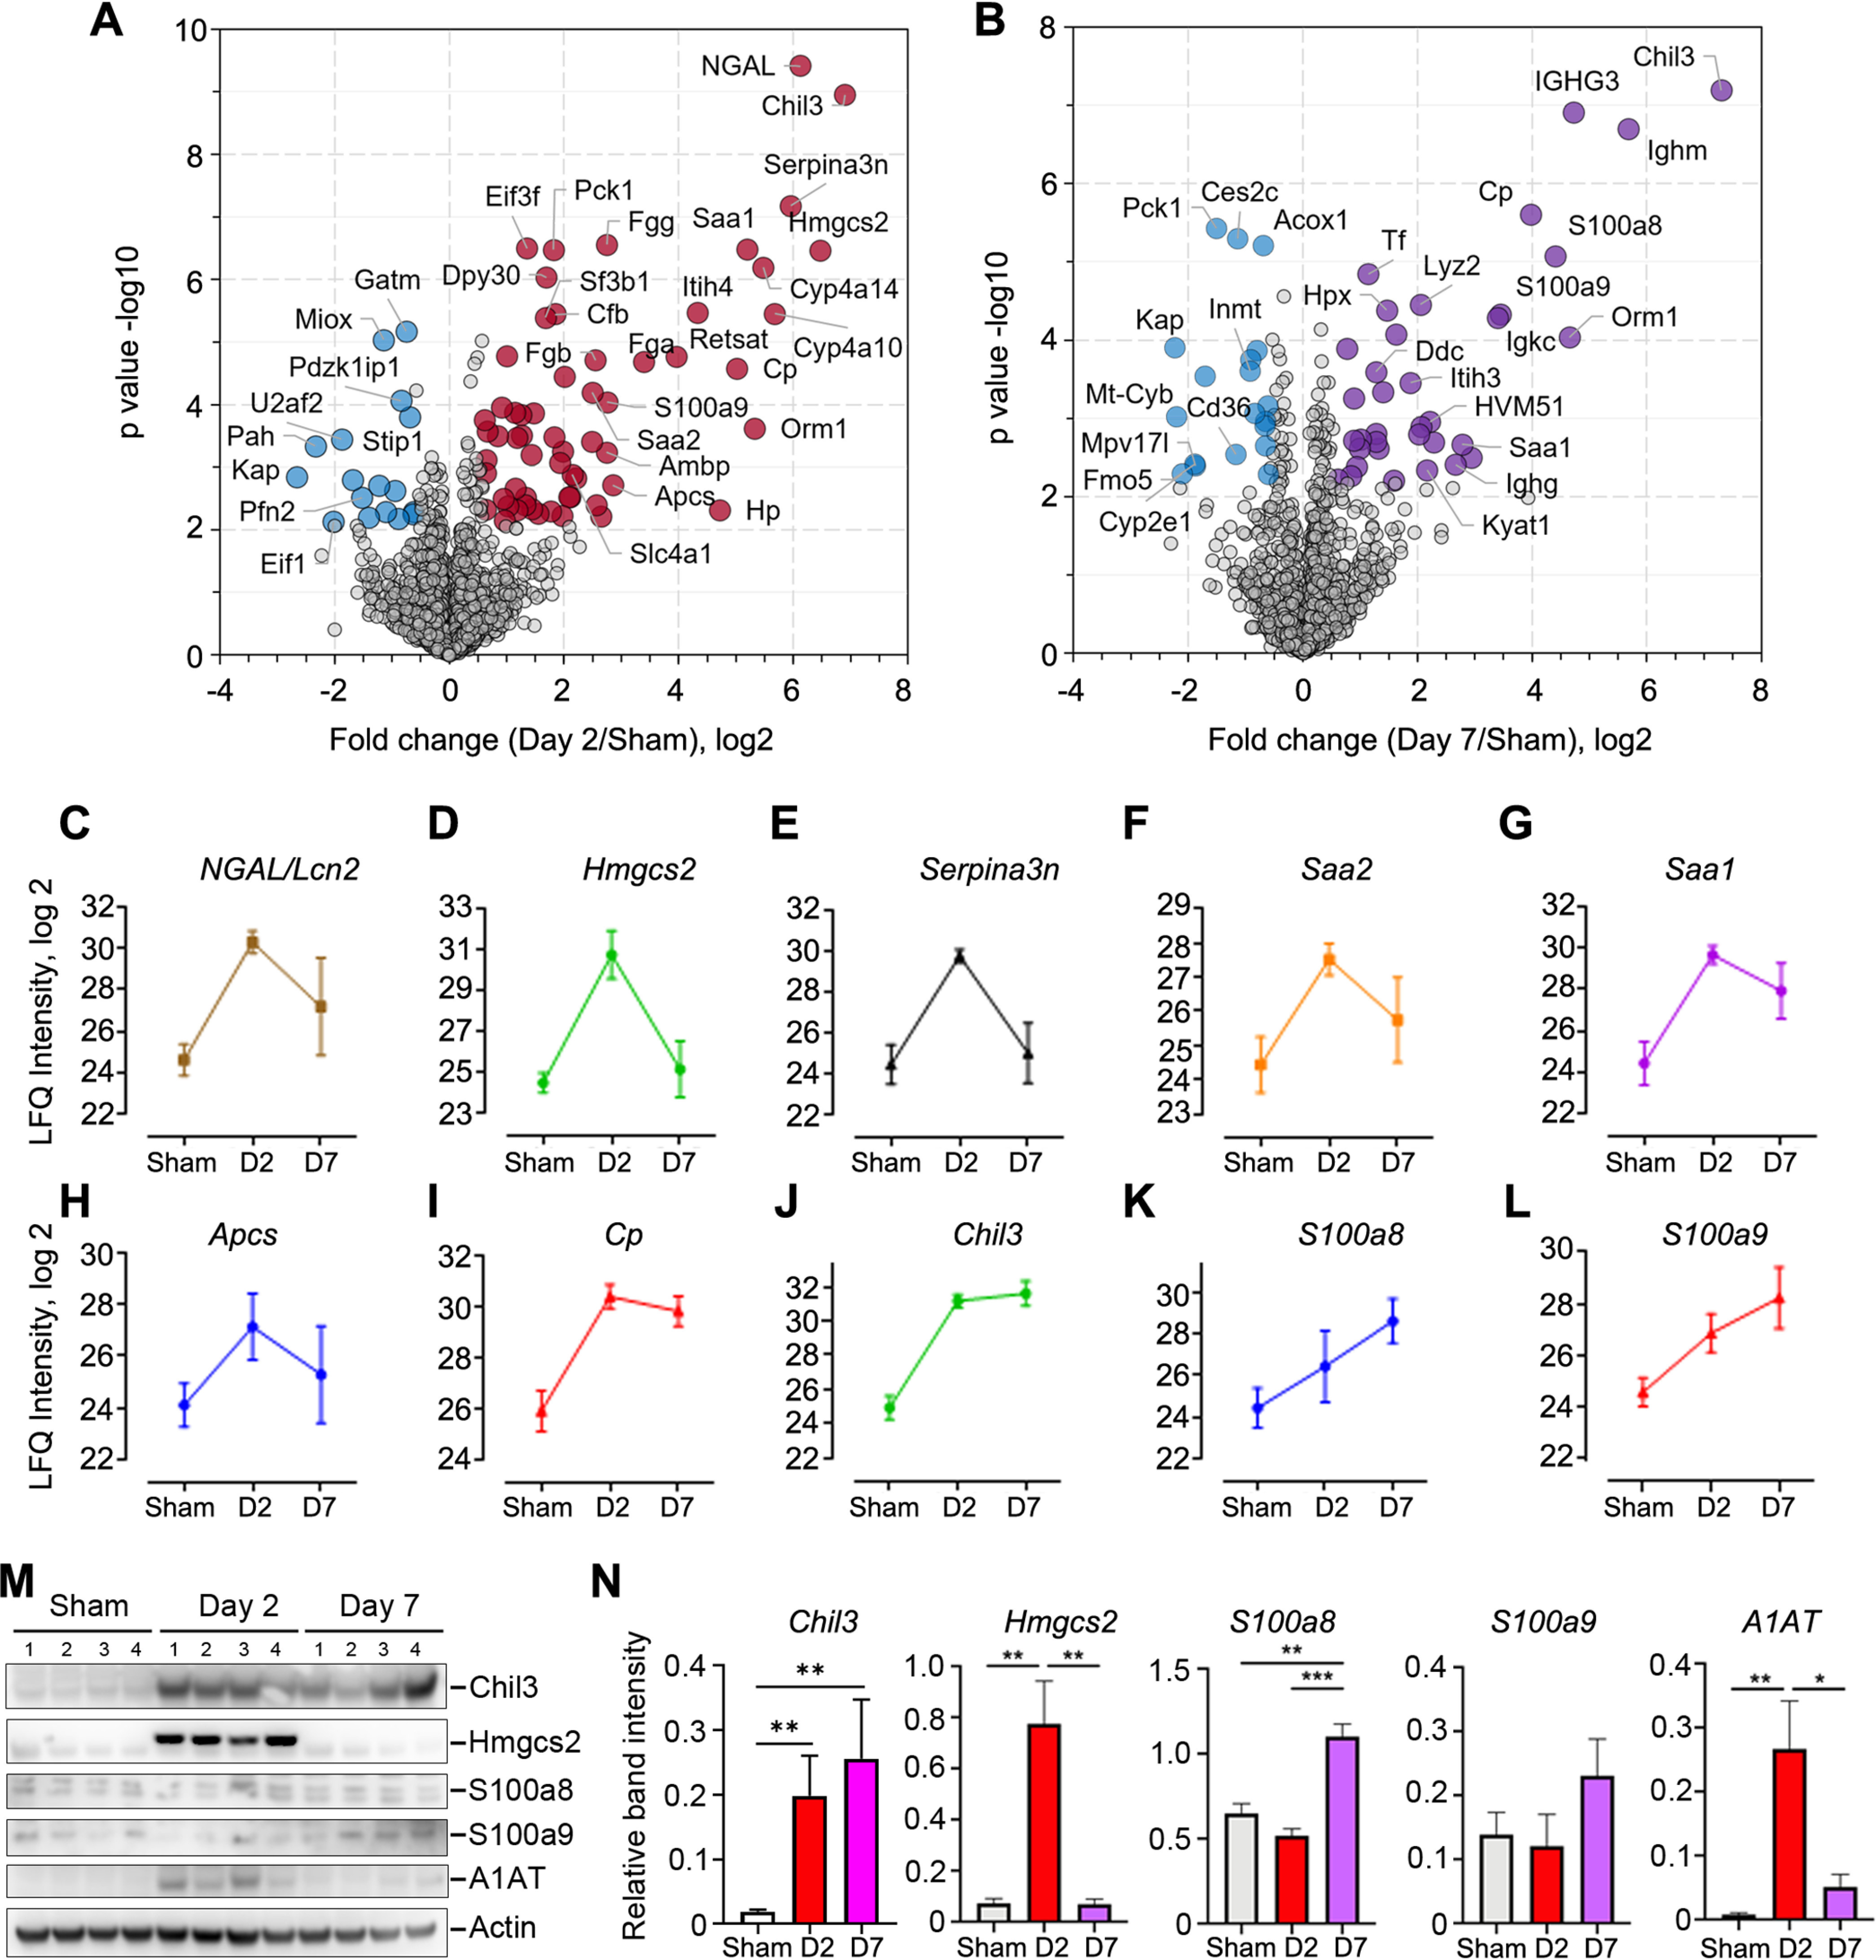
Fig. 5.

Kinetic changes of sepsis-induced kidney injury markers. A–B, Volcano plot of pairwise comparison between the kidney proteomes of day 2 or day 7 post-CLP versus control. Student t test (Permutation FDR 0.05) was used for the analyses. Up- and down-regulated proteins by 1.5-fold were colored in red/purple and blue, respectively. Gene name of represented proteins were indicated in the plots. C–L, Abundance plots of representative proteins in response to septic injury. Mean values and error bars from six replicates of each group were shown. M–N, Western blot validation and densitometry quantitation of representative marker proteins. *, p < 0.05; **, p < 0.01; ***, p < 0.001.
