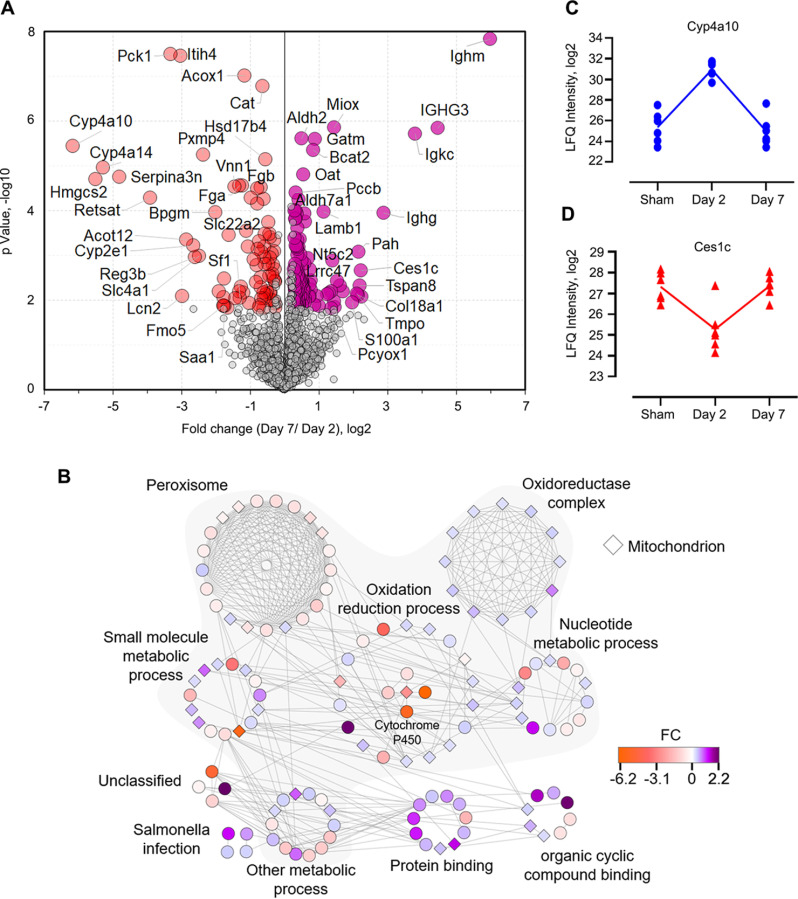
Fig. 6.
Metabolic modifications in kidneys occur upon CLP-induced sepsis. A, Volcano plot shows the p value (y axis) and fold change (x axis) of proteins identified in both groups of kidneys. Significant proteins are highlighted in red and purple for up- and down-regulated proteins, respectively (Permutation FDR 0.05; FC ≥ 1.2). B, Interaction network of the significant proteins as shown in A. The network and enrichment results were derived from String App in Cytoscape software. The score cutoff for interaction confidence was set to 0.9. Shaded clusters are involved in metabolic processes. The color coding is in accordance to fold changes between day 7 and day 2. Diamond shape depicts mitochondrion associated proteins. C–D, Intensity plot of two representative proteins associated with the oxidation-reduction process.

