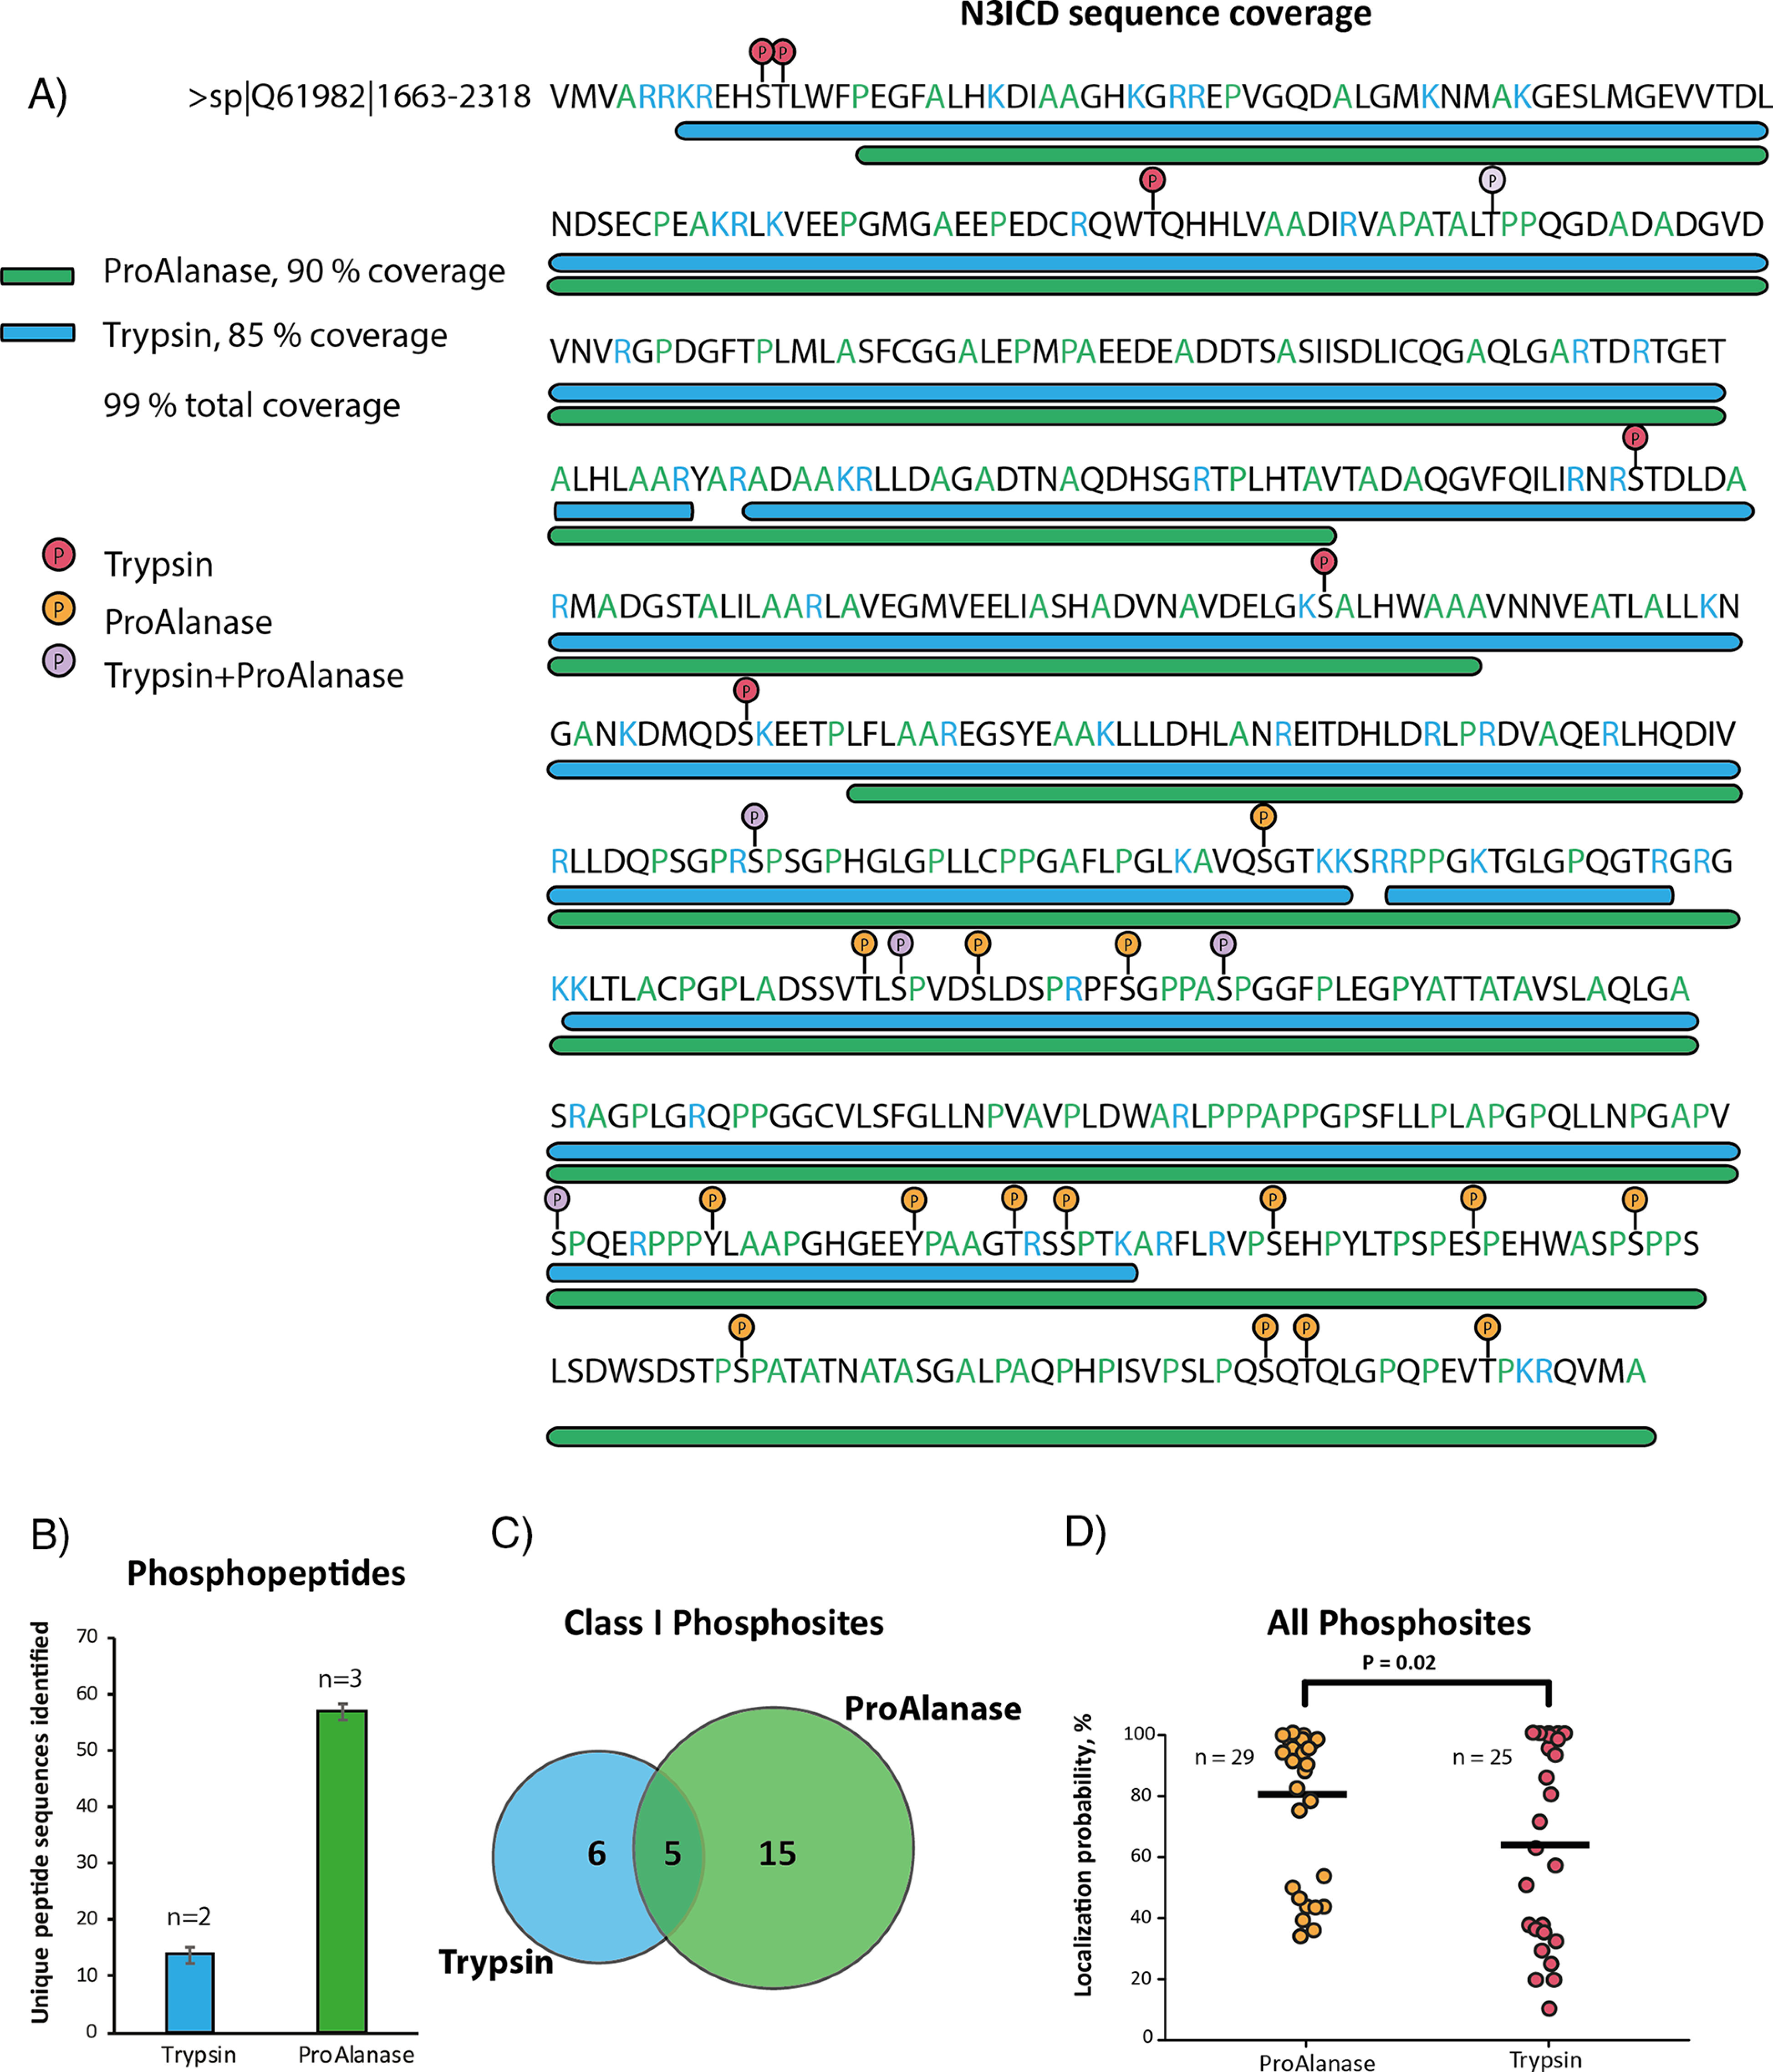
Fig. 5.

Phosphorylation profiling in immunoprecipitated N3ICD protein. A sequence coverage plot (A) showing the coverage of N3ICD protein sequence by concatenated ProAlanase and tryptic peptides obtained from in-gel digestion of N3ICD protein immunoprecipitates (n = 2). Average number of unique phosphopeptide sequences (B) identified in ProAlanase (n = 3) and tryptic (n = 2) digests of N3ICD immunoprecipitates. A Venn Diagram (C) showing an overlap of class I (localization probability ≥ 75%) phosphorylation sites in ProAlanase- and trypsin digested samples of N3ICD protein immunoprecipitates (n = 2). A scatter plot (D) of all phosphorylation sites identi_ed in ProAlanase and tryptic digests of N3ICD protein (n = 2). The variances were estimated using the two-sample Fisher's exact test and the significance was determined with the one-tailed two-sample t test (α = 0.05) with equal variance. The mean value is highlighted as a dash and n corresponds to the number of unique phosphorylation sites identified with each of the proteases.
