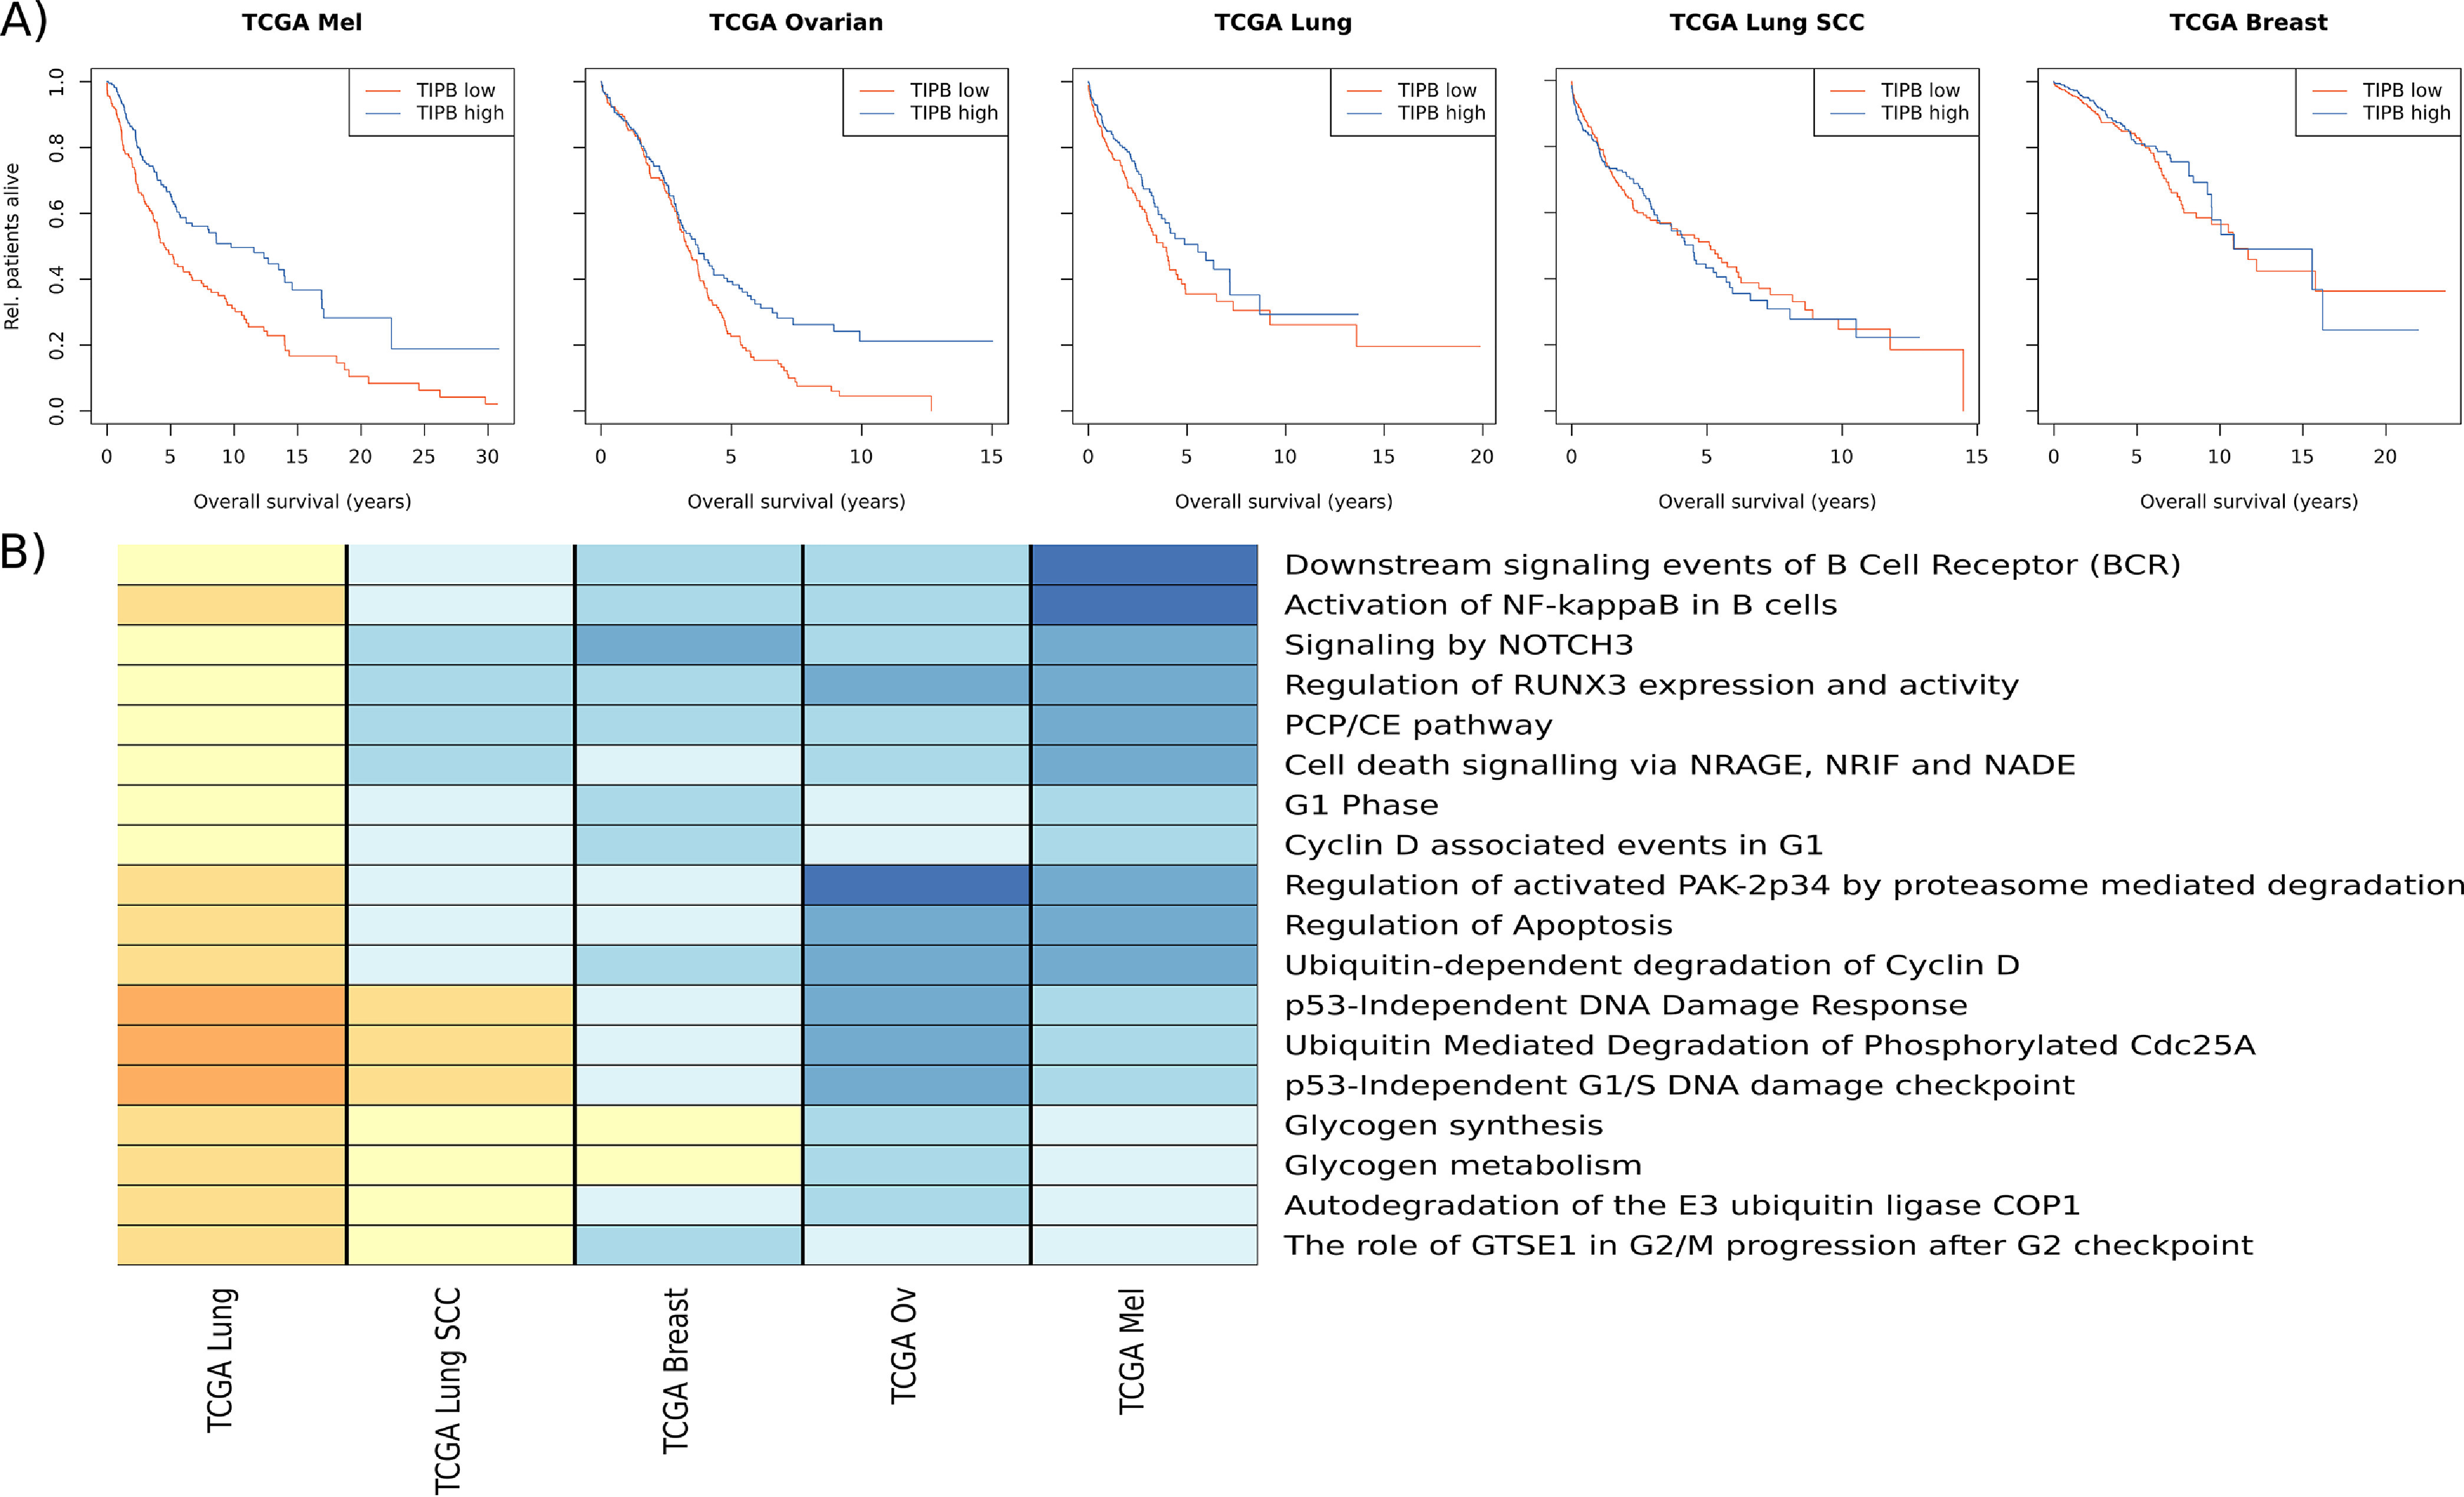
Fig. 4.

Comparison of TIPB-high versus -low samples from TCGA studies on melanoma (TCGA Mel), ovarian cancer (TCGA Ovarian), lung adenocarcinoma study (TCGA Lung), lung squamous cell carcinoma (TCGA Lung SCC), and breast cancer (TCGA Breast). A, Overall survival of patients with high (blue line) or low (red line) expression of the TIPB signature (split by the median expression in the data set). B, Average gene fold-changes per pathway. Only pathways significantly regulated (FDR < 0.1) in the TCGA melanoma and the TCGA lung adenocarcinoma cohort with a different direction of regulation in these two cohorts are shown. Shades of yellow represent a down-regulation, shades of blue an up-regulation.
