
Fig. 5.
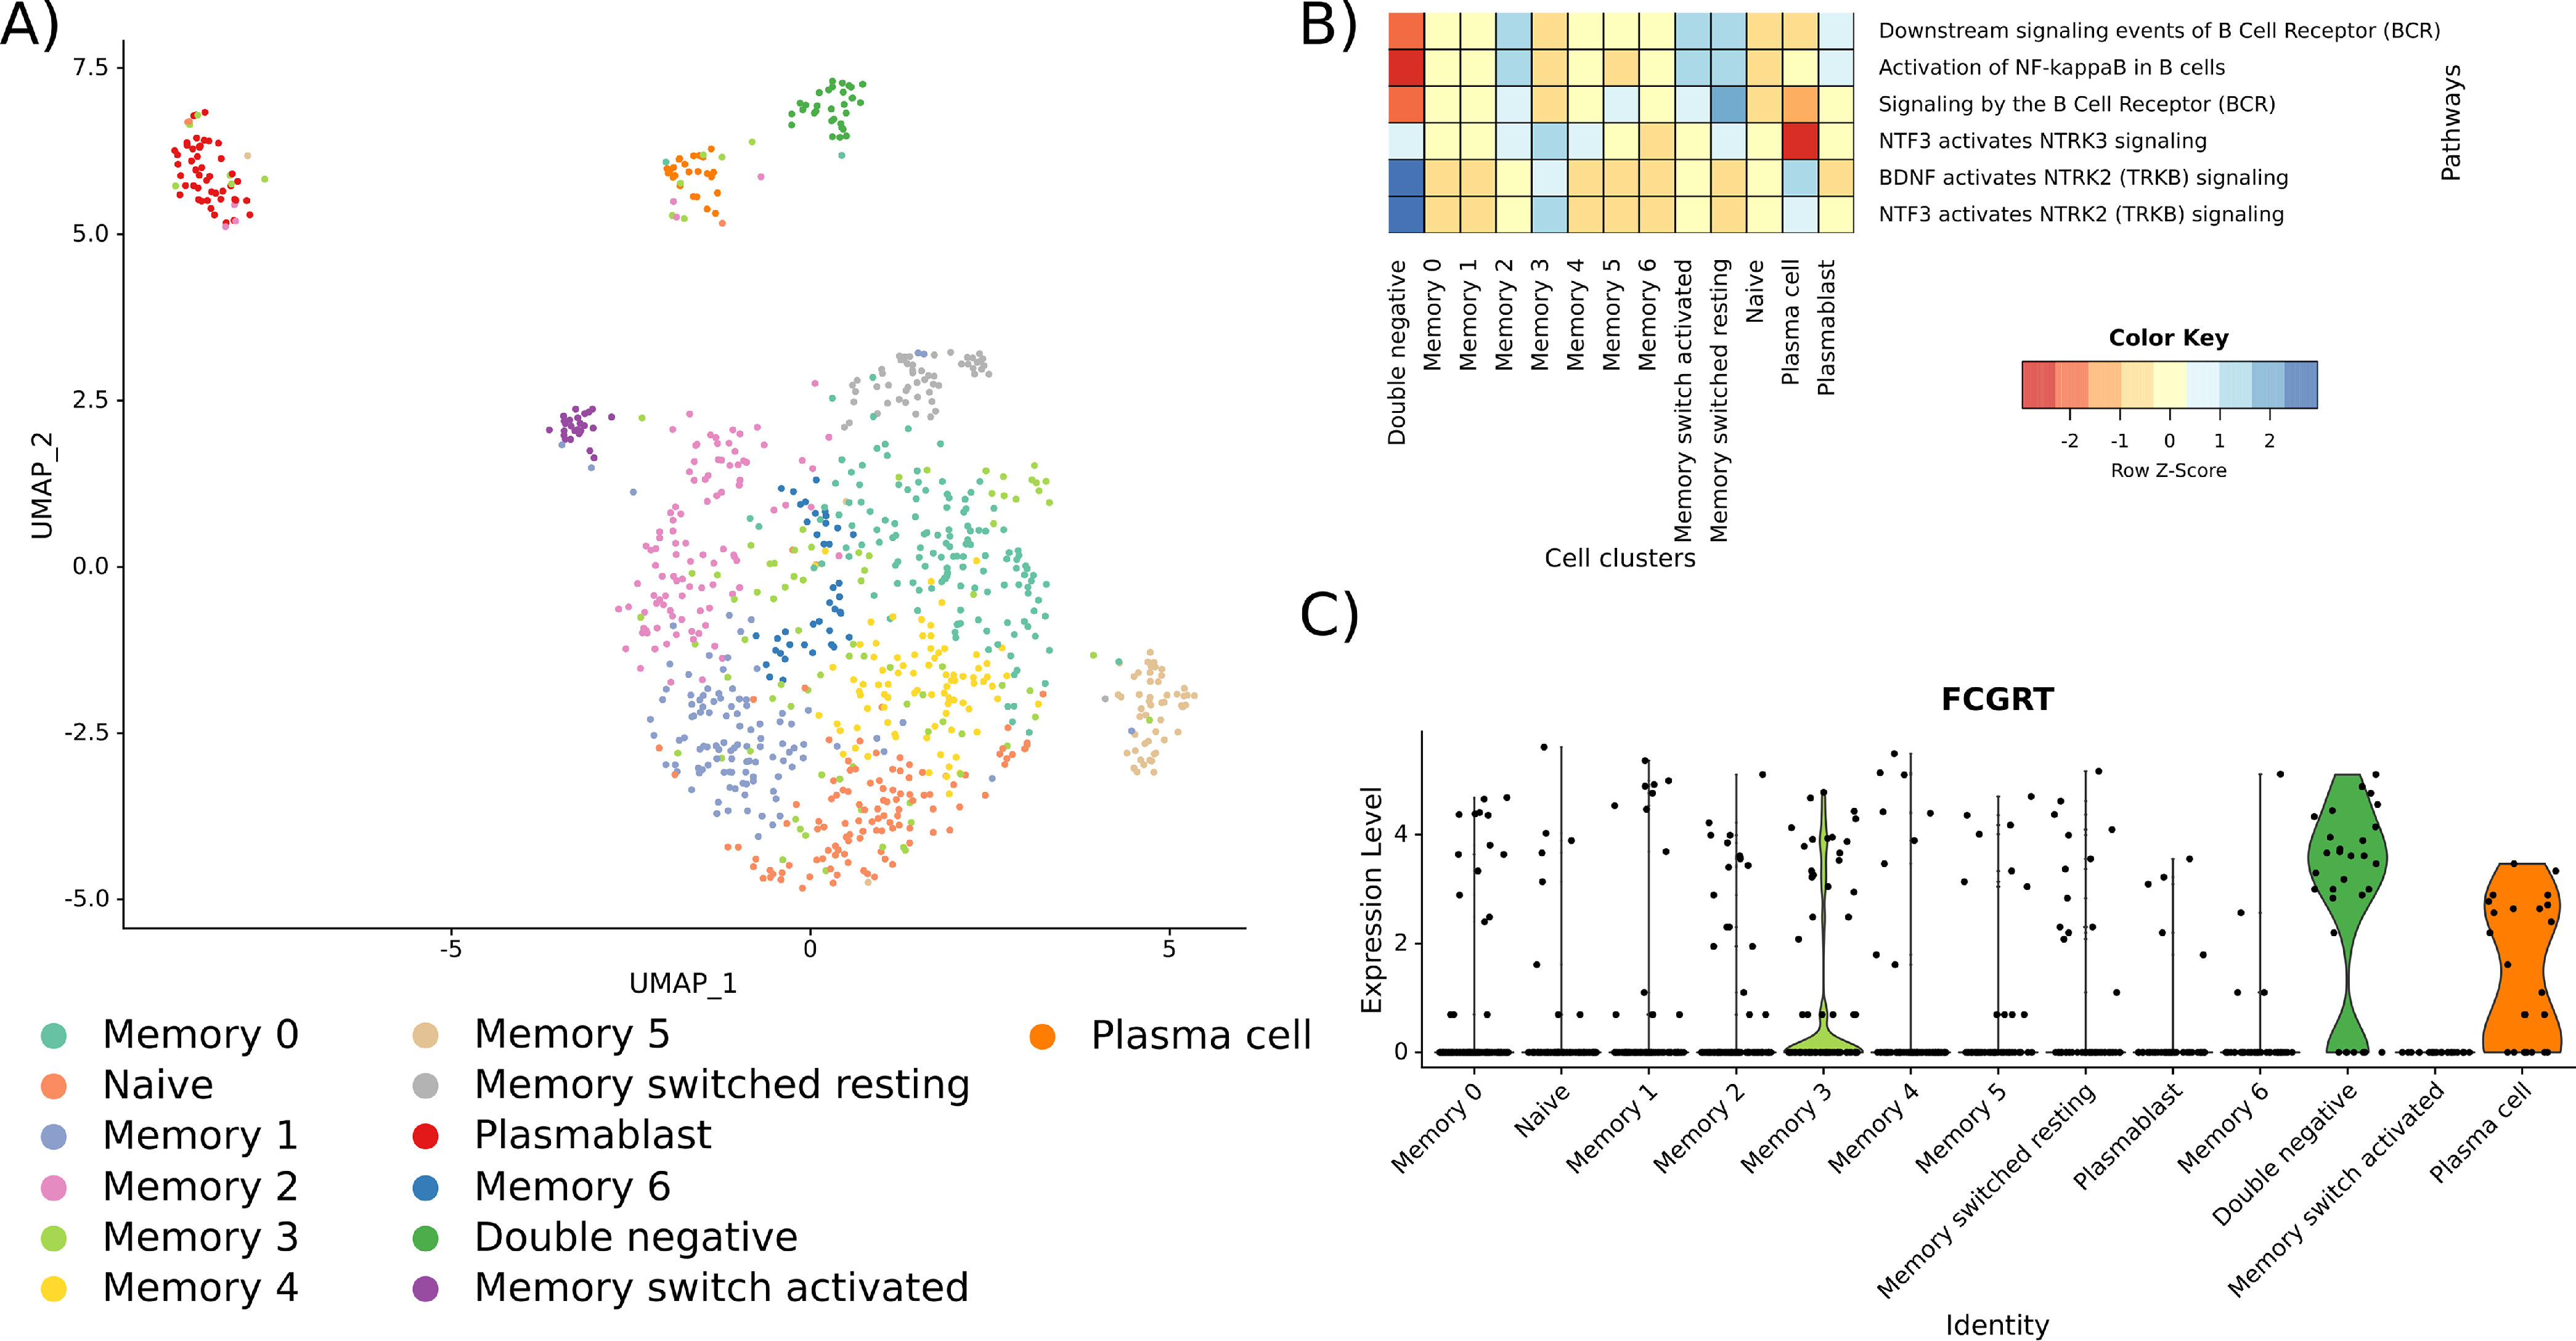
Analysis of B cell subtypes from the data set by Jerby-Arnon et al. (32) A, UMAP plot of the identified B cell clusters. Cell type annotations are based on canonical B cell markers (33). B, ReactomeGSA gene set variation based pathway-level expression in the identified B cell clusters of the Jerby-Arnon et al. Data set. Expression values were z-score normalized by pathway. C, Expression of IgG estimated through FCGRT abundance in the B cell clusters.