
Fig. 3.
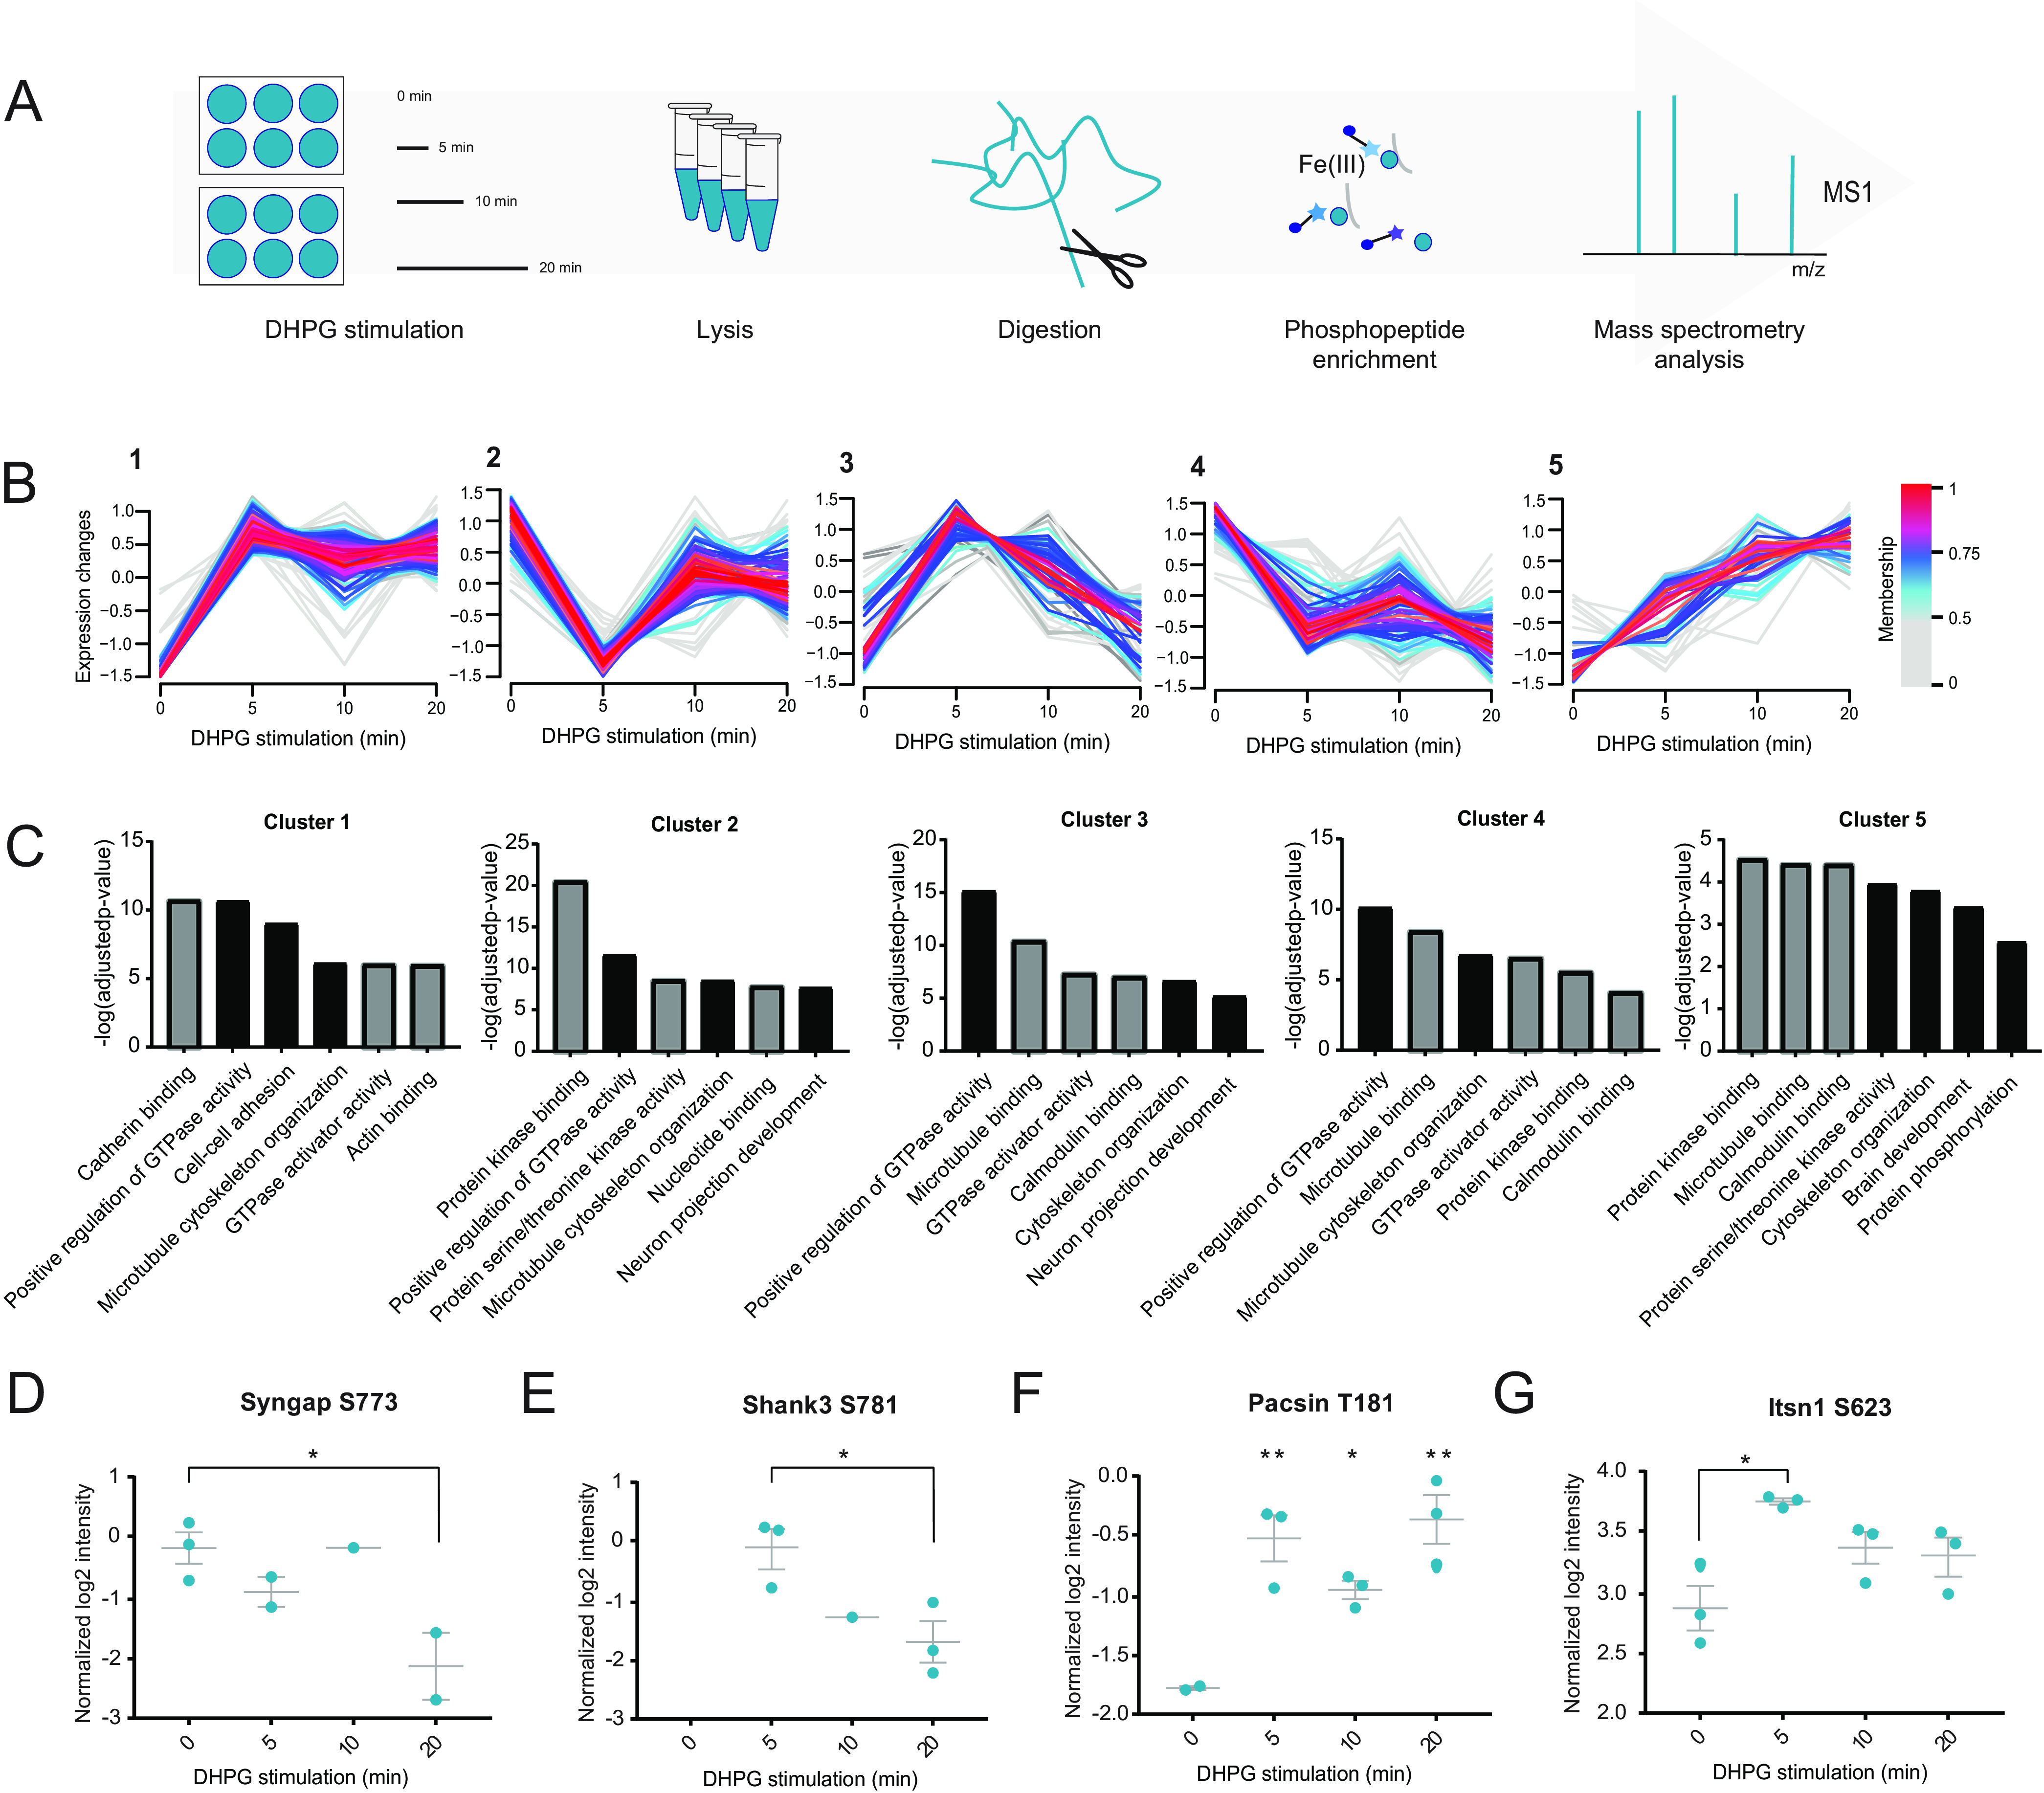
Quantitative phosphoproteomics of mGluR signaling in hippocampal neurons stimulated with DHPG. A, Quantitative phosphoproteomics workflow: samples were taken at 0, 5, 10 and 20 min after the addition of DHPG. B, Unsupervised clustering reveals five distinct clusters for the regulated phosphosites. C, GO-term enrichment analysis for molecular function (grey) and biological process (black). d–G, Normalized log2 intensities of regulated phosphosites upon DHPG stimulation. Data are represented as mean±S.E., * p < 0.05, ** p < 0.01, as determined with a one-way ANOVA.