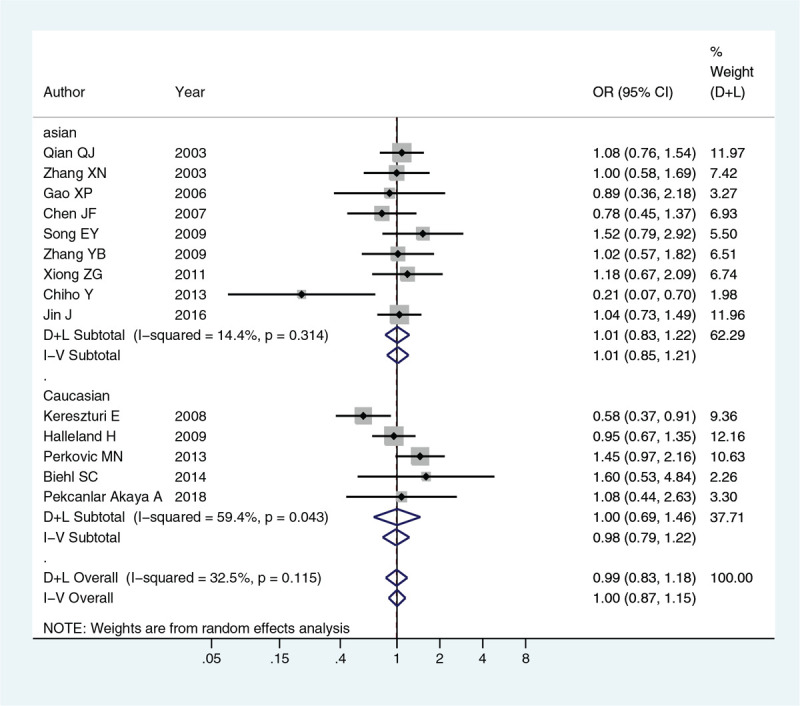
Figure 2.

Forest plot of ORs for the association of COMT gene Val158Met polymorphism with ADHD risk in dominant model (GA+AA vs GG). The upper, middle, and lower panels are for Asian, Caucasian, and overall populations, respectively. Each panel contains both fixed (denoted as I-V) and random (denoted as D + L) effect model pooled ORs White diamond denotes the pooled OR. Black squares indicate the OR in each study, with square sizes inversely proportional to the standard error of the OR. Horizontal lines represent 95% CIs.
