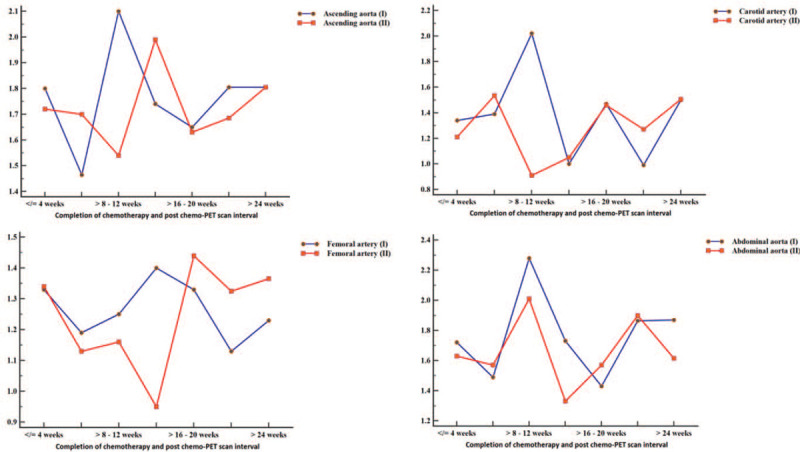
Figure 2.

Time trend in TBR in patients grouped according to the interval between completion of chemotherapy and the time of follow-up FDG PET/CT scan. The blue curve represents the TBR obtained on the pre-chemotherapy FDG PET/CT, while the red curve represents TBR obtained in different groups at post-chemotherapy FDG PET/CT. Like for SUVmax shown in Fig. 1, TBR was lower for the post-therapy FDG PET/CT compared with pre-chemotherapy FDG PET/CT in multiple time-points in the trend. In the group in whom post-chemotherapy FDG PET/CT was obtained more than 24 wk after completion of chemotherapy, TBR in the arterials from the post-chemotherapy FDG PET/CT equaled (ascending aorta, carotid artery) or surpassed (femoral artery) that of the pre-chemotherapy FDG PET/CT. TBR of post-chemotherapy FDG PET/CT remained below that of the pre-chemotherapy FDG PET/CT scan in the abdominal aorta.
