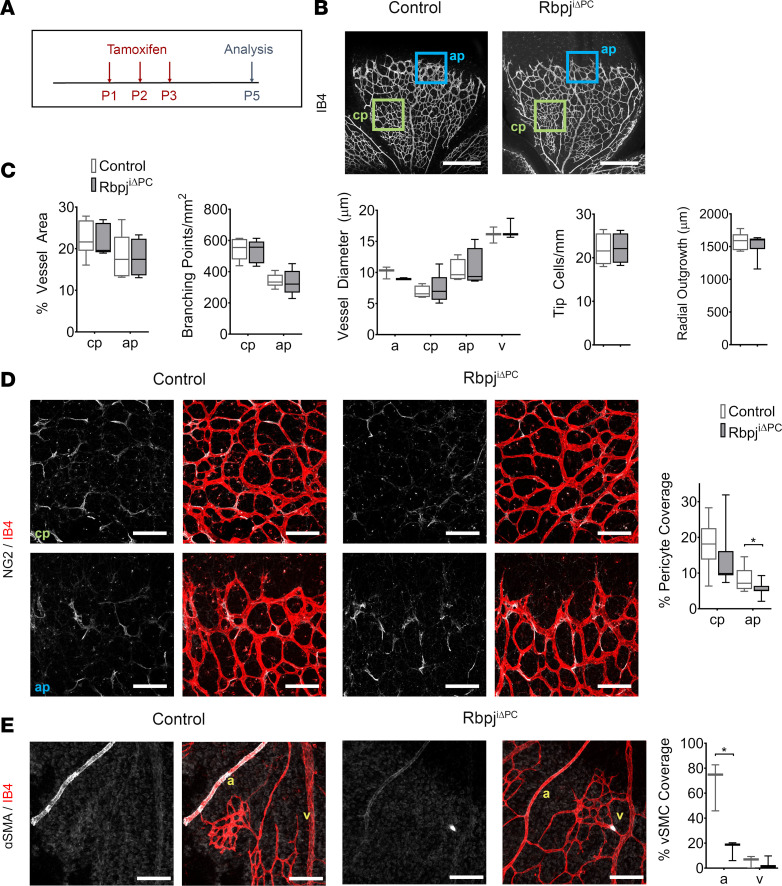
Figure 3. Decreased pericyte coverage in RbpjiΔPC mice at P5.
(A) Diagram of tamoxifen administration to postnatal control and RbpjiΔPC mice and analysis at P5. (B) Confocal images showing P5 retinal vasculature stained with Isolectin B4 (IB4, white). Blue box represents the angiogenic plexus (ap), and green box represents the capillary plexus (cp) utilized for analysis. Scale bars: 450 μm. (C) Quantification of percentage of vessel area (n = 5–6), branching points/mm2 (n = 5), vessel diameter (n = 3–5), tip cells/mm2 (n = 4), and radial outgrowth (n = 6–8) in control and RbpjiΔPC mice. (D) High-magnification confocal images and quantification of NG2+ pericytes. NG2 (white) labels the pericytes and IB4+ (red) labels the vessels in the capillary and angiogenic plexus. Scale bars: 100 μm. Quantification of percentage of pericyte coverage (n = 9–11). (E) IB4 (red) staining highlights the arteries and veins and α-SMA (white) represents the vascular smooth muscle cells (vSMCs). Scale bars: 100 μm. Quantification of percentage of vSMC coverage (n = 3) reveals reduced arterial coverage. Box-and-whisker plots show median, minimum, and maximum values. Data were analyzed using unpaired 2-tailed t test with Welch’s correction. a, artery; v, vein. *P < 0.05.

