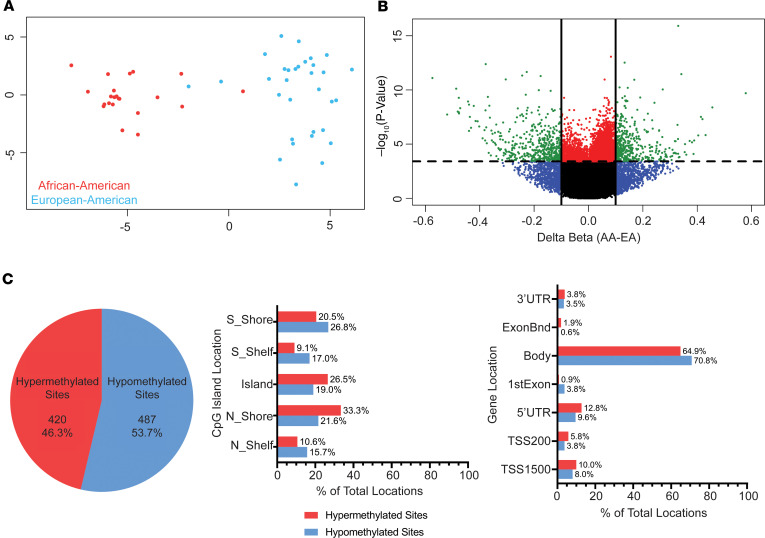
Figure 2. Neutrophils of African American and European American lupus patients show DNA methylation differences associated with ancestry.
(A) Multidimensional scaling plot of top 5000 most variable CpG sites in African American (n = 22; red circles) and European American (n = 32; blue circles) lupus patients at initial sample collection. (B) Volcano plot of differentially methylated CpG sites between African American (n = 22) and European American (n = 32) lupus patients at initial sample collection. Each dot represents a CpG site (n = 745,477). Significantly differentially methylated sites (green) are differentially methylated by at least 10% between ancestry groups and with an FDR-adjusted P < 0.05 (n = 907). (C) Pie chart (left) showing the percentage of sites hypermethylated (n = 420; 46.3%) and hypomethylated (n = 487; 53.7%) in African American compared with European American lupus patients. Barcharts showing the distribution of hypermethylated (red) and hypomethylated (blue) sites annotated to locations with CpG islands and genes (middle and right, respectively). S_Shore: south shore; S_Shelf: south shelf; N_Shore: north shore; N_Shelf: north shelf. 3′-UTR: 3′ untranslated region; ExonBnd: exon boundary; 5′-UTR: 5′ untranslated region; TSS200: 200 bp upstream of transcription start site; TSS1500: 1500 bp upstream of transcription start site.

