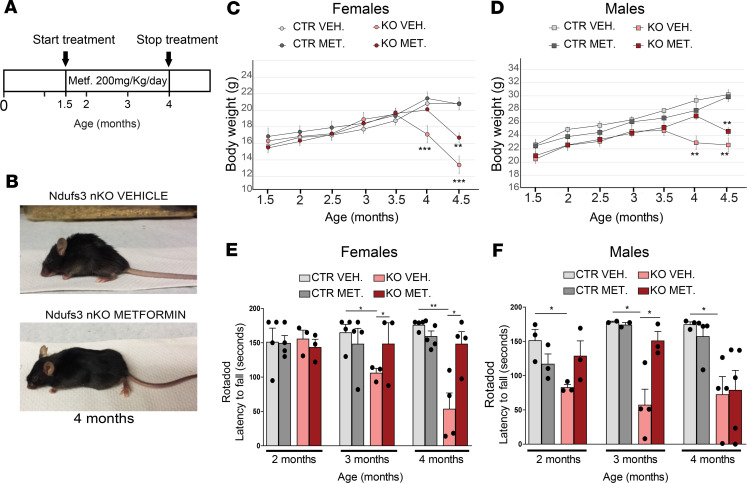
Figure 5. Metformin treatment delays the onset of the phenotype in Ndufs3 nKO mice.
(A) Schematic representation of the protocol used for metformin treatment. (B) Representative images of 4-month-old vehicle-treated Ndufs3 nKO female mice and metformin-treated Ndfus3 nKO female mice. (C) Body weight comparison over time of female mice: vehicle-treated Ndufs3 nKO (pink circles; n = 4); metformin-treated Ndufs3 nKO (red circles; n = 5), vehicle-treated controls (light gray circles, n = 6), and metformin-treated controls (dark gray circles, n = 3). (D) Body weight comparison over time of male mice: vehicle-treated Ndufs3 nKO (pink squares; n = 6), metformin-treated Ndufs3 nKO (red squares; n = 3), vehicle-treated controls (light gray squares, n = 7), and metformin-treated controls (dark gray squares, n = 5). (E and F) Rotarod performance of control and Ndufs3 nKO female mice (E) and male mice (F) of 2, 3, and 4 months of age (n = 3–5/group). Statistical significance was determined using 1-way ANOVA. Pairwise Bonferroni’s post tests were used to compare different groups in all panels. Data are presented as mean ± SEM. *P < 0.05, **P < 0.01, ***P < 0.001.

