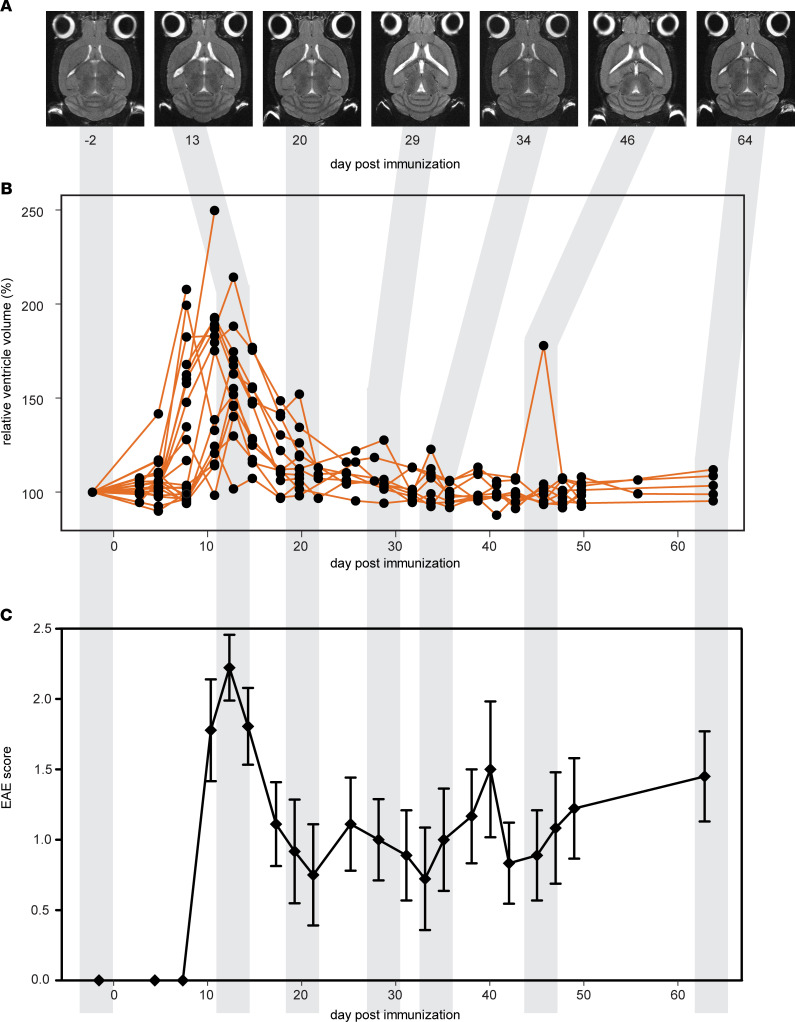
Figure 1. Ventricle volume changes dynamically during the course of EAE.
(A) T2-weighted horizontal MRI scans of a representative mouse brain show changes in ventricle size from baseline (day –2) to day 64 p.i. (B) Brain ventricle volume plotted as a percentage of baseline values (n = 35). By day 8 p.i., the mean volume was 130.8% ± 7.74% (± SEM) of the baseline volume (P < 0.001, ANOVA), well beyond the range of normal variation in healthy SJL mice of ± 6%. Ventricle volume peaked at days 11–13 p.i. and returned to baseline levels by day 22 p.i. (C) Emergence and remission of EAE clinical signs coincided with the peak expansion and contraction of ventricle volume (mean ± SEM).

