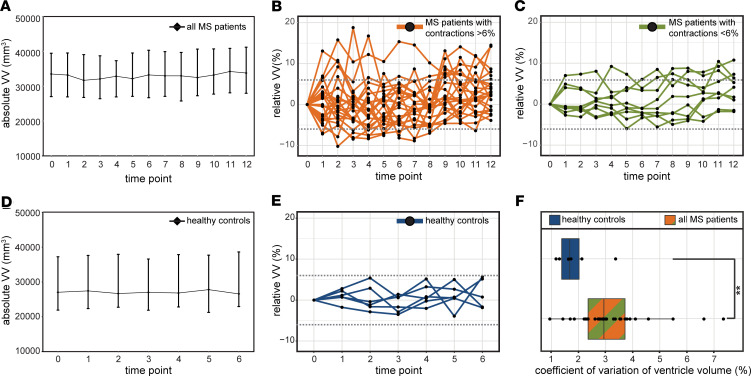
Figure 6. Relapsing-remitting MS patients show dynamic changes in ventricle volumes.
(A) Over the course of 1 year, the cohort of MS patients showed a small but significant increase in ventricle volume of +284 mm, equivalent to +0.08406% (median ± IQR, P = 0.0006, Wilcoxon signed rank test, n = 33). (B and C) Plotting the values for individual patients showed a heterogeneous picture, with some individuals showing high variability in ventricle volume (B) and others showing lower variability (C). (D) A reference cohort of healthy subjects showed no significant changes over the course of a 6-month observation period (n = 6). (E) The maximum change in ventricle volume of the healthy subjects was ± 6%. (F) The MS patient cohort showed significantly greater variability in ventricle volumes (as indicated by the coefficient of variation) compared with healthy controls (**P = 0.0065, Student’s t test).

