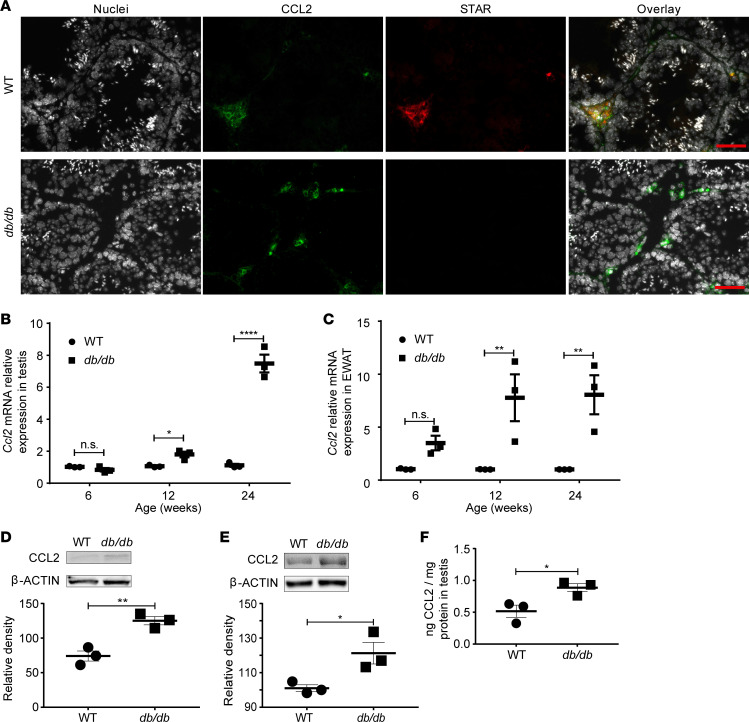
Figure 4. CCL2 expression was increased in db/db mice.
(A) Representative sections show colocalization of CCL2 in STAR-positive cells of WT controls. Scale bar: 20 μm. CCL2 is present in STAR-negative cells close to the basal membrane of the tubuli. (B) The Ccl2 mRNA levels in testes. N = 3 in each group. (C) The Ccl2 mRNA levels in EWAT. N = 3 in each group. (D) CCL2 protein in testes as determined by Western blot and followed by quantification. N = 3 in each group. (E) CCL2 protein expression in EWAT as determined by Western blot and followed by quantification. N = 3 in each group. (F) CCL2 protein concentration in testes as determined by ELISA. N = 3 in each group. Panels A, D, and E show representative images of 1 analysis per mouse. Data represent 1 of 3 independent experiments and are shown as means ± SEM. Student’s 2-tailed t test was used to compare means between 2 groups. *P < 0.05, **P < 0.01, ****P < 0.0001.

