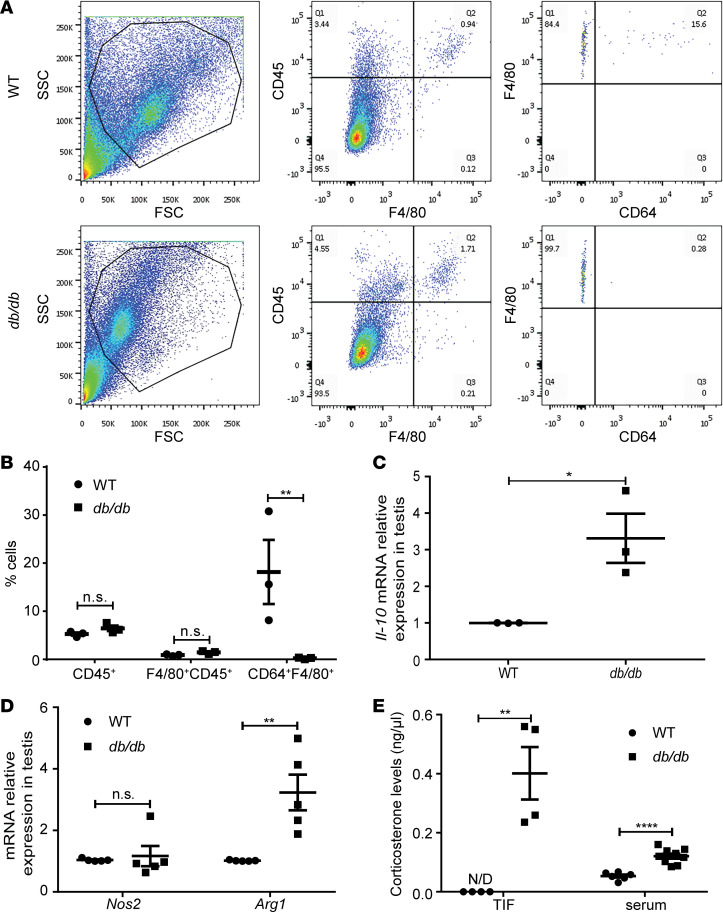
Figure 5. Testicular immune cells and corticosterone levels in db/db mice.
(A) Total testicular cells were isolated as described in Methods and examined by FACS. Representative flow cytometry gating schemes for testicular cells from WT and db/db mice are demonstrated. The gating strategy is shown for CD45+F4/80+ and F4/80+CD64+ cells. (B) Frequencies of testicular F4/80+ within CD45+ cells and CD64+ within F4/80+CD45+ cells from WT and db/db mice. (C) The Il-10 mRNA expression in testes. (D) The Nos2 and Arg1 mRNA expression in testes. (E) Corticosterone levels in TIF and serum. N= 3–8 mice, 12 to 24 weeks old, in each group. Data are shown as means ± SEM. Student’s 2-tailed t test was used to compare means between 2 groups. *P < 0.05, **P < 0.01, ****P < 0.0001.

