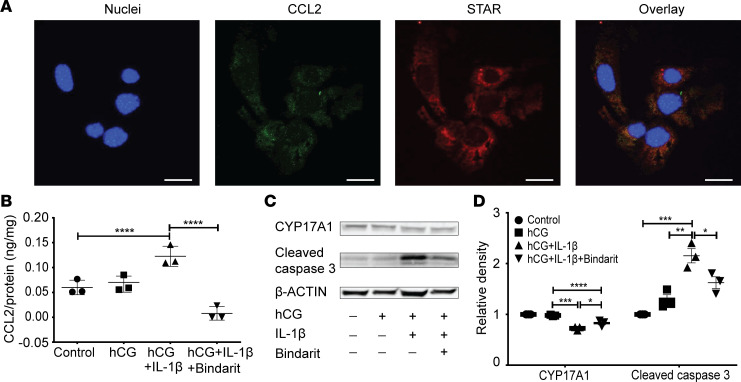
Figure 6. CCL2 regulated function and apoptosis of MLTC-1 cells.
(A) Representative pictures showing MLTC-1 cells express CCL2 under basal cultivating conditions. (B) Amount of CCL2 in the culture medium. (C and D) Western blot analysis of CYP17A1 and cleaved caspase-3 in MLTC-1 cells after 48 hours’ treatment with human chorionic gonadotropin (hCG) in the absence or presence of IL-1β (1 ng/mL), with or without the CCL2 inhibitor Bindarit (100 μM). N = 3 in each group. Data represent one of 3 independent experiments and are shown as means ± SEM. One-way ANOVA was used to compare means between groups followed by Tukey’s post hoc comparisons. *P < 0.05, **P < 0.01, ****P < 0.0001.

