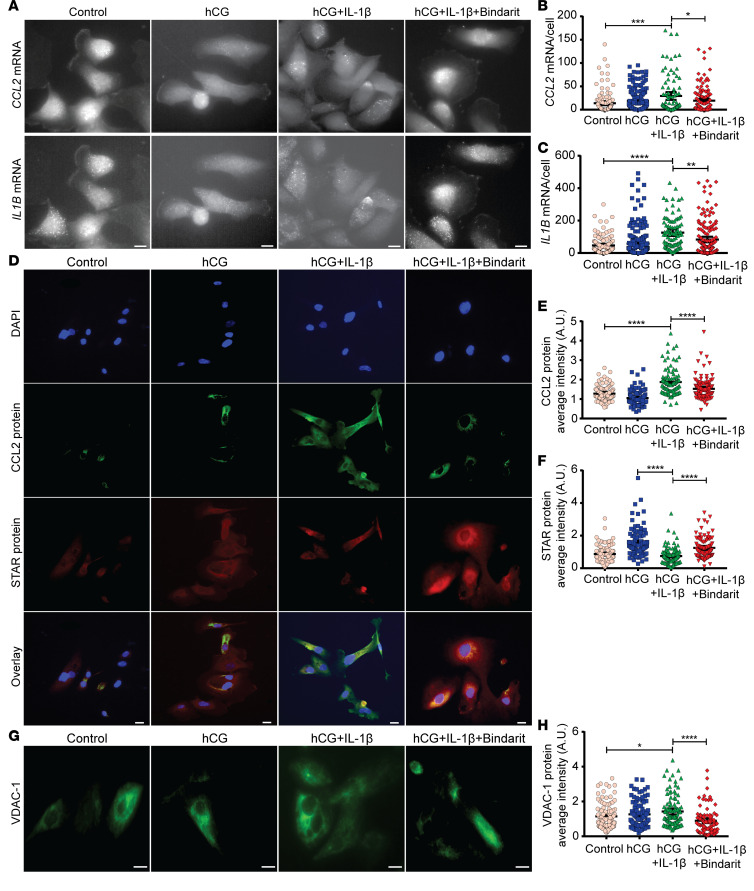
Figure 7. CCL2 regulated function and apoptosis of primary human Leydig cells.
(A–C) Representative pictures showing CCL2 and ILB mRNA expressions in HLC after 48 hours’ treatment with hCG in the absence or presence of IL-1β (1 ng/mL), with or without Bindarit (100 μM) (A), followed by quantification: number of CCL2 (B) and ILB (C) mRNA molecules per HLC. (D–F) Representative pictures showing CCL2 and STAR protein expressions in HLC after 48 hours’ treatment with hCG in the absence or presence of IL-1β (1 ng/mL), with or without Bindarit (100 μM) (D), followed by quantification: average fluorescence intensity of CCL2 (E) and STAR (F) per HLC. (G and H) Representative pictures showing voltage-dependent anion-selective channel 1 (VDAC-1) protein expression in HLC after 48 hours’ treatment with hCG in the absence or presence of IL-1β (1 ng/mL), with or without Bindarit (100 μM) (G), followed by quantification, average fluorescence intensity of VDAC-1 per HLC (H). Data represent at least 3 independent experimental runs. Scale bar: 10 μm. N = ~100–180 cells in each group. Data represent 1 of 3 independent experiments and are shown as means ± SEM. One-way ANOVA was used to compare means between groups followed by Tukey’s post hoc comparisons. *P < 0.05, **P < 0.01, ***P < 0.001, ****P < 0.0001.

