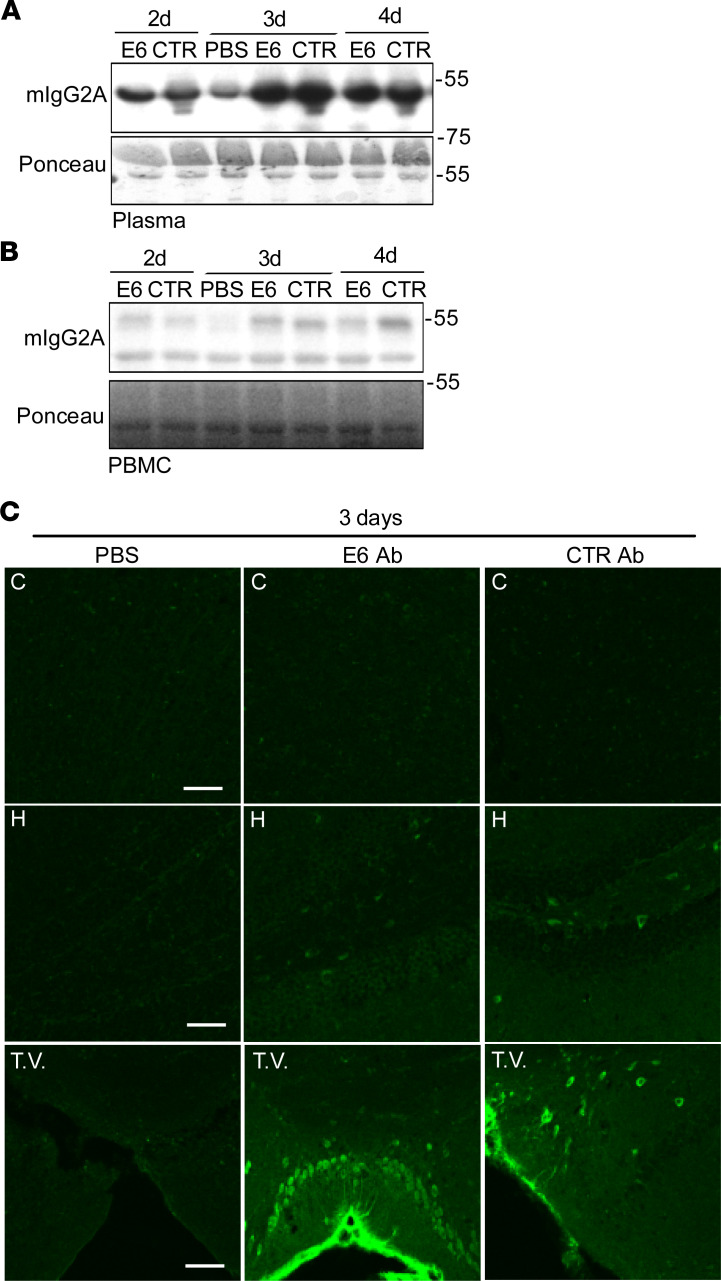
Figure 5. Tissue and cellular distribution after i.p. delivery.
(A and B) Western blot for mIgG2A in plasma (A) and PBMC (B) total lysate from mice injected i.p. with E6, CTR Ab, or equal volume of PBS. Ponceau was used as loading control. (C) Ab distribution after 3 days from injection in coronal sections of cortex (C), hippocampus (H), and third ventricle (T.V.). Signal represents mIgG2A (green). Scale bar: 50 μm. One mouse per condition was used, but results were confirmed in multiple sections from the areas of interest. The control antibody used was clone 807.33.

